Plot heatmap of observed counts
plot_counts_obs(mat = NULL, ...)Arguments
- mat
A matrix with count data reporting interaction frequency (e.g. visits to flowers, number of fruits consumed per plant or species). Plants must be in rows, Animals must be in columns.
- ...
Further arguments for
network.tools::plot_web_heatmap().
Value
A ggplot object
Examples
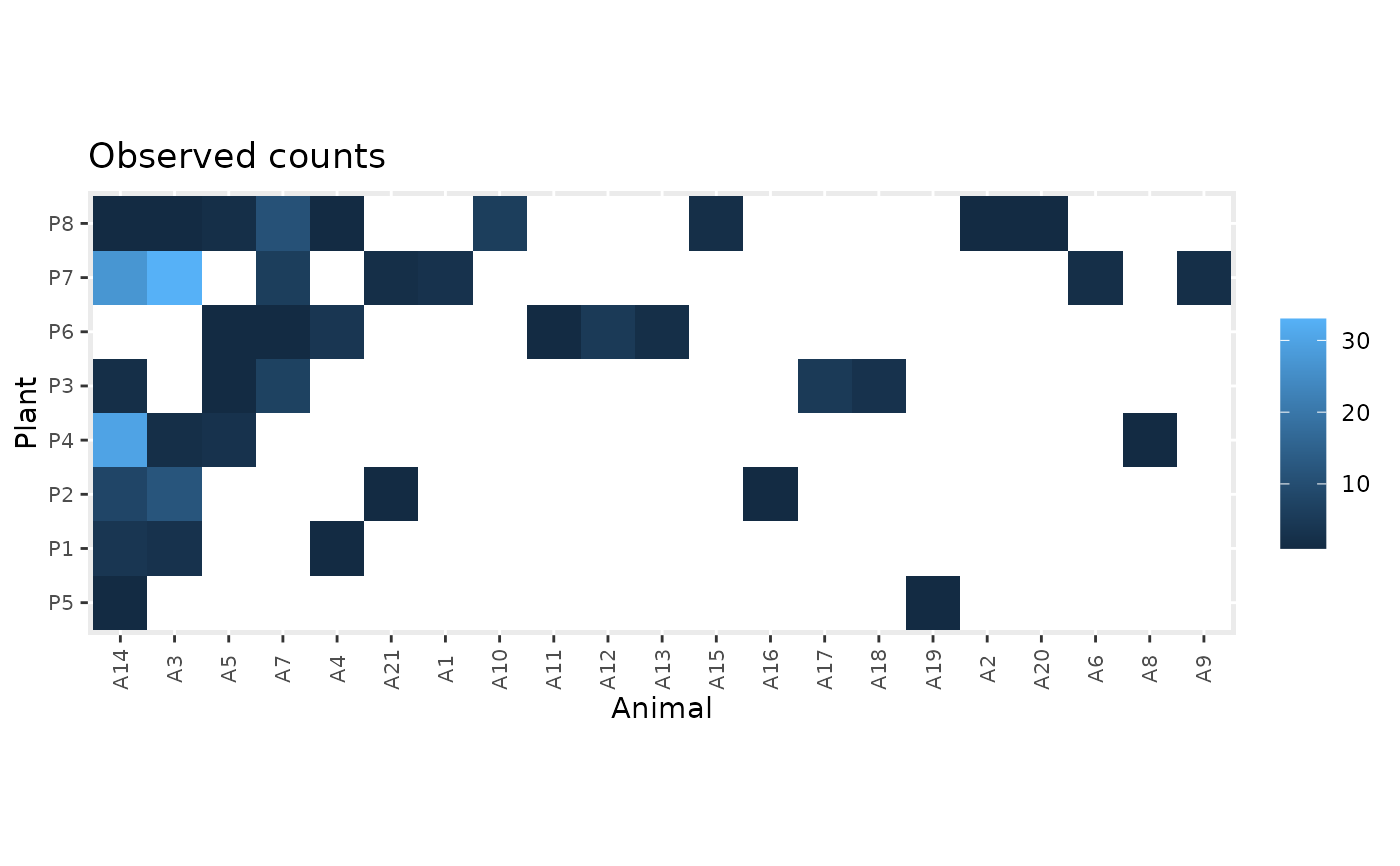
data(web)
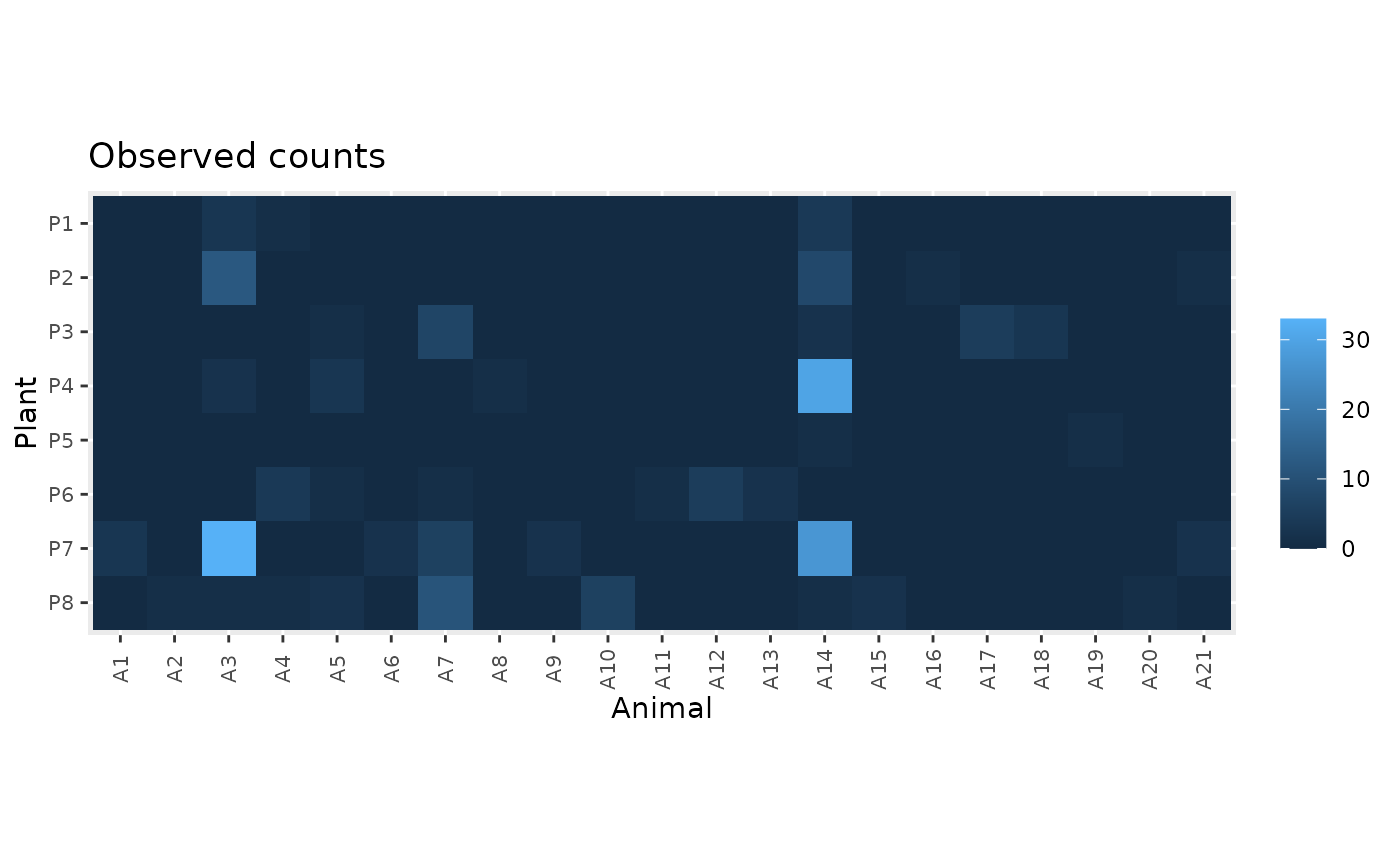
plot_counts_obs(web)
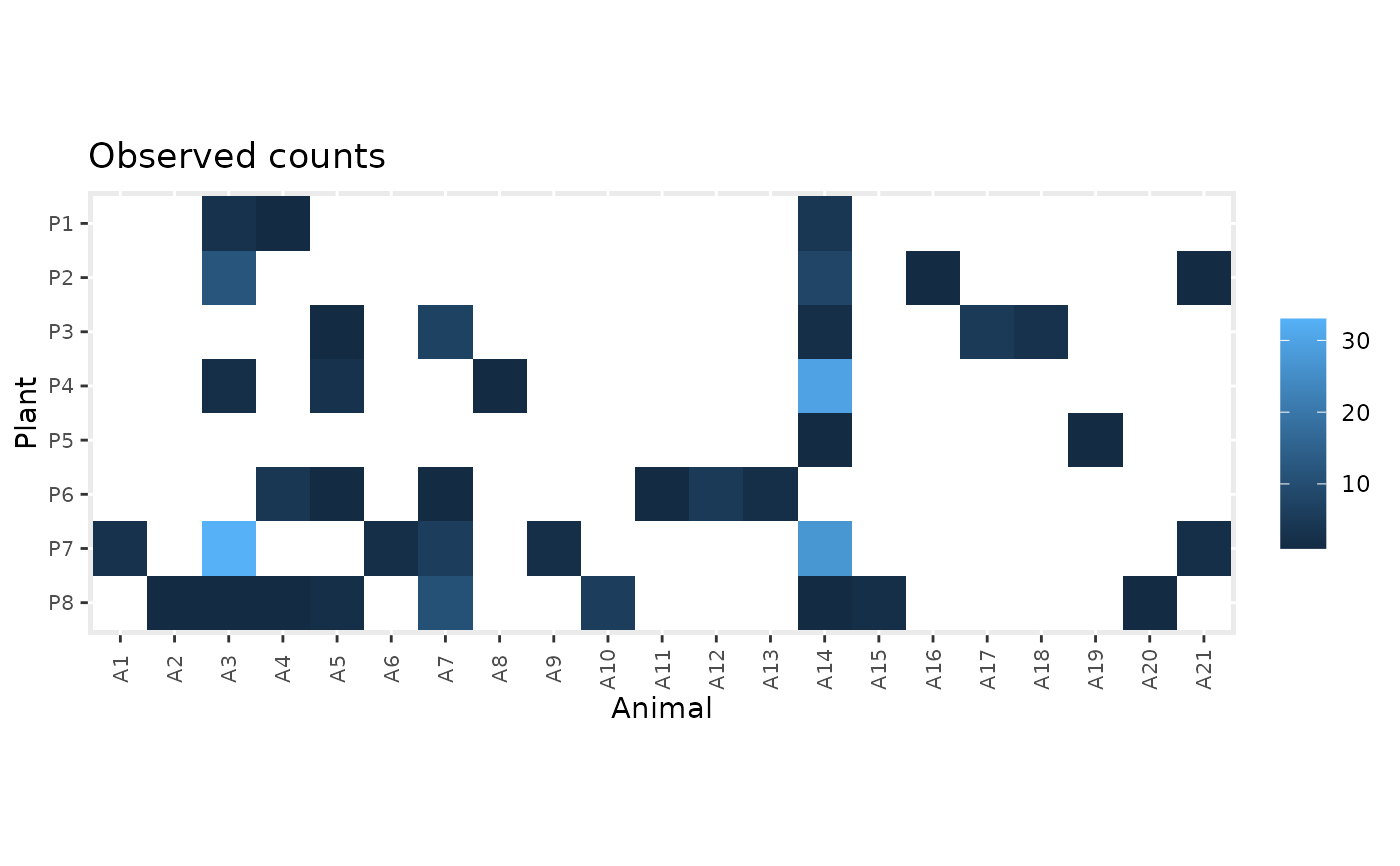
 plot_counts_obs(web, sort = FALSE)
 plot_counts_obs(web, zero.na = FALSE, sort = FALSE)