class: center, middle, inverse, title-slide # GIS with R ## Francisco Rodriguez-Sanchez ### <span class="citation">@frod_san</span> --- ## R: Not only for stats <img src="images/R.jpg" width="640px" height="480px" /> --- class: inverse, center, middle # R can make beautiful maps --- ## Made in R <img src="images/bike_ggplot.png" width="640px" height="480px" /> <small>http://spatial.ly/2012/02/great-maps-ggplot2/</small> --- ## Made in R <img src="images/facebook_map.png" width="640px" height="480px" /> <small>http://paulbutler.org/archives/visualizing-facebook-friends/</small> --- ## Made in R <img src="images/airMadrid_stamen.png" width="580px" height="480px" /> <small>http://oscarperpinan.github.io/spacetime-vis/</small> --- ## Made in R <img src="images/cft.png" width="640px" height="480px" /> <small>http://oscarperpinan.github.io/spacetime-vis/</small> --- ## Made in R <img src="images/vLine.svg" width="640px" height="480px" /> <small>http://oscarperpinan.github.io/spacetime-vis/</small> --- ## Made in R <div id="htmlwidget-5a9e12a9f6b9cb59b306" style="width:640px;height:480px;" class="leaflet html-widget"></div> <script type="application/json" data-for="htmlwidget-5a9e12a9f6b9cb59b306">{"x":{"options":{"crs":{"crsClass":"L.CRS.EPSG3857","code":null,"proj4def":null,"projectedBounds":null,"options":{}}},"calls":[{"method":"addTiles","args":["//{s}.tile.openstreetmap.org/{z}/{x}/{y}.png",null,null,{"minZoom":0,"maxZoom":18,"tileSize":256,"subdomains":"abc","errorTileUrl":"","tms":false,"noWrap":false,"zoomOffset":0,"zoomReverse":false,"opacity":1,"zIndex":1,"detectRetina":false,"attribution":"© <a href=\"http://openstreetmap.org\">OpenStreetMap<\/a> contributors, <a href=\"http://creativecommons.org/licenses/by-sa/2.0/\">CC-BY-SA<\/a>"}]},{"method":"addMarkers","args":[36.5,-6,null,null,null,{"interactive":true,"draggable":false,"keyboard":true,"title":"","alt":"","zIndexOffset":0,"opacity":1,"riseOnHover":false,"riseOffset":250},"You are here",null,null,null,null,{"interactive":false,"permanent":false,"direction":"auto","opacity":1,"offset":[0,0],"textsize":"10px","textOnly":false,"className":"","sticky":true},null]}],"fitBounds":[30,-10,40,0,[]],"limits":{"lat":[36.5,36.5],"lng":[-6,-6]}},"evals":[],"jsHooks":[]}</script> <small>https://rstudio.github.io/leaflet/</small> --- ## Made in R <img src="images/spinglobe.gif" width="480px" height="480px" /> <small>http://spatial.ly/2017/05/spinning-globes-with-r/</small> --- ## Made in R <img src="images/sciencemap.jpg" width="720px" height="400px" /> <small>http://science.sciencemag.org/content/suppl/2016/09/28/353.6307.1532.DC1</small> --- ## Made in R <img src="images/cartography.png" width="640px" height="400px" /> <small>https://cran.r-project.org/package=cartography</small> --- ## Made in R <img src="images/tmap.png" width="640px" height="400px" /> <small>https://cran.r-project.org/package=tmap</small> --- ## Made in R <img src="images/rayshader-1.jpg" width="640px" height="400px" /> <small>https://github.com/tylermorganwall/rayshader</small> --- ## Made in R <img src="images/rayshader-2.jpg" width="640px" height="400px" /> <small>https://github.com/tylermorganwall/rayshader</small> --- class: inverse, center, middle # R can make beautiful maps And beautiful stats too --- class: inverse, center, middle # Spatial data in R Using R as a GIS --- ## Basic packages for spatial data - sf (sp) - raster (stars) - rgeos - rgdal And many more: see - [Spatial CRAN Task View](https://cran.r-project.org/web/views/Spatial.html) - [Mapping Task View](https://github.com/ropensci/maptools) --- ## Spatial data types in R - **Vectorial** (sp/sf): - Points - Lines - Polygons - **Raster**: - RasterLayer: - 1 grid - RasterStack: - multiple layers with same extent, resolution & projection - RasterBrick: - multiple layers (= RasterStack) but stored in a single file --- class: inverse, center, middle # Vector data --- ## Importing vector data ```r library(sf) countries <- st_read("data/eucountries.shp") # or gpkg, etc ``` ``` ## Reading layer `eucountries' from data source `C:\Users\FRS\Dropbox\Rcode\myRcode\courses_talks\GISwithR\data\eucountries.shp' using driver `ESRI Shapefile' ## Simple feature collection with 38 features and 4 fields ## geometry type: MULTIPOLYGON ## dimension: XY ## bbox: xmin: -24.32618 ymin: 34.91999 xmax: 40.08079 ymax: 80.65714 ## epsg (SRID): 4326 ## proj4string: +proj=longlat +datum=WGS84 +no_defs ``` --- ## `sf` objects are data.frames! (w/ geometry column) ```r head(countries) ``` ``` ## Simple feature collection with 6 features and 4 fields ## geometry type: MULTIPOLYGON ## dimension: XY ## bbox: xmin: 2.513573 ymin: 39.625 xmax: 32.69364 ymax: 56.16913 ## epsg (SRID): 4326 ## proj4string: +proj=longlat +datum=WGS84 +no_defs ## name pop_est gdp_md_est subregion ## 1 Albania 3639453 21810 Southern Europe ## 2 Austria 8210281 329500 Western Europe ## 3 Belgium 10414336 389300 Western Europe ## 4 Bulgaria 7204687 93750 Eastern Europe ## 5 Bosnia and Herz. 4613414 29700 Southern Europe ## 6 Belarus 9648533 114100 Eastern Europe ## geometry ## 1 MULTIPOLYGON (((20.59025 41... ## 2 MULTIPOLYGON (((16.97967 48... ## 3 MULTIPOLYGON (((3.314971 51... ## 4 MULTIPOLYGON (((22.65715 44... ## 5 MULTIPOLYGON (((19.00549 44... ## 6 MULTIPOLYGON (((23.48413 53... ``` --- ## So we can easily manipulate them (e.g. dplyr) Remove column: ```r library(dplyr) countries <- dplyr::select(countries, -gdp_md_est) ``` --- ## So we can easily manipulate them (e.g. dplyr) Filter cases: ```r west.eu <- filter(countries, subregion == "Western Europe") west.eu ``` ``` ## Simple feature collection with 7 features and 3 fields ## geometry type: MULTIPOLYGON ## dimension: XY ## bbox: xmin: -4.59235 ymin: 41.38001 xmax: 16.97967 ymax: 54.9831 ## epsg (SRID): 4326 ## proj4string: +proj=longlat +datum=WGS84 +no_defs ## name pop_est subregion geometry ## 1 Austria 8210281 Western Europe MULTIPOLYGON (((16.97967 48... ## 2 Belgium 10414336 Western Europe MULTIPOLYGON (((3.314971 51... ## 3 Switzerland 7604467 Western Europe MULTIPOLYGON (((9.594226 47... ## 4 Germany 82329758 Western Europe MULTIPOLYGON (((9.921906 54... ## 5 France 64057792 Western Europe MULTIPOLYGON (((9.560016 42... ## 6 Luxembourg 491775 Western Europe MULTIPOLYGON (((6.043073 50... ## 7 Netherlands 16715999 Western Europe MULTIPOLYGON (((6.074183 53... ``` --- ## So we can easily manipulate them (e.g. dplyr) Summarise data: ```r countries %>% group_by(subregion) %>% summarise(mean(pop_est)) ``` ``` ## Simple feature collection with 4 features and 2 fields ## geometry type: GEOMETRY ## dimension: XY ## bbox: xmin: -24.32618 ymin: 34.91999 xmax: 40.08079 ymax: 80.65714 ## epsg (SRID): 4326 ## proj4string: +proj=longlat +datum=WGS84 +no_defs ## # A tibble: 4 x 3 ## subregion `mean(pop_est)` geometry ## <fct> <dbl> <GEOMETRY [°]> ## 1 Eastern Eur~ 17017028. POLYGON ((28.55808 43.70746, 28.0391 43.293~ ## 2 Northern Eu~ 9834469. MULTIPOLYGON (((-6.197885 53.86757, -6.0329~ ## 3 Southern Eu~ 12230634. MULTIPOLYGON (((23.69998 35.705, 24.24667 3~ ## 4 Western Eur~ 27117773. MULTIPOLYGON (((9.560016 42.15249, 9.229752~ ``` --- ## So we can easily manipulate them (e.g. dplyr) Create new columns: ```r countries <- mutate(countries, pop.million = pop_est/1000000) ``` --- ## Basic plotting ```r plot(countries) ``` 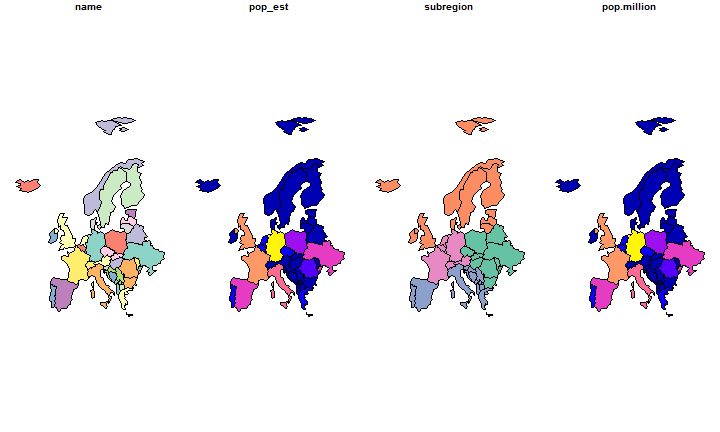<!-- --> --- ## Basic plotting ```r plot(countries["subregion"]) ``` 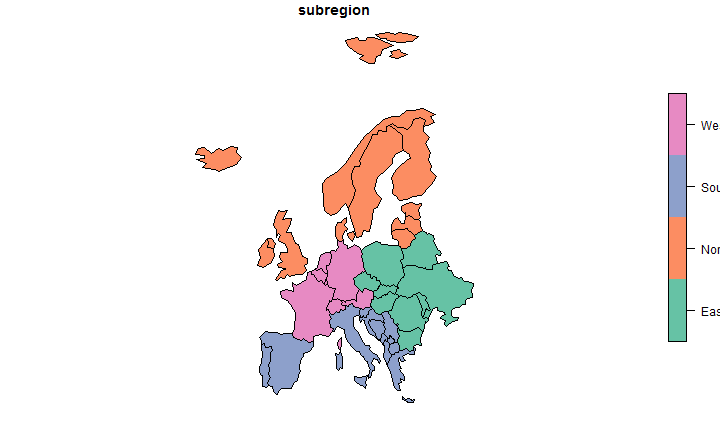<!-- --> --- ## Interactive plot (leaflet) ```r library(mapview) mapview(countries) ``` <div id="htmlwidget-a7bfb1997cde3fc63110" style="width:576px;height:432px;" class="leaflet html-widget"></div> <script type="application/json" data-for="htmlwidget-a7bfb1997cde3fc63110">{"x":{"options":{"minZoom":1,"maxZoom":100,"crs":{"crsClass":"L.CRS.EPSG3857","code":null,"proj4def":null,"projectedBounds":null,"options":{}},"preferCanvas":false,"bounceAtZoomLimits":false,"maxBounds":[[[-90,-370]],[[90,370]]]},"calls":[{"method":"addProviderTiles","args":["CartoDB.Positron",1,"CartoDB.Positron",{"errorTileUrl":"","noWrap":false,"detectRetina":false}]},{"method":"addProviderTiles","args":["CartoDB.DarkMatter",2,"CartoDB.DarkMatter",{"errorTileUrl":"","noWrap":false,"detectRetina":false}]},{"method":"addProviderTiles","args":["OpenStreetMap",3,"OpenStreetMap",{"errorTileUrl":"","noWrap":false,"detectRetina":false}]},{"method":"addProviderTiles","args":["Esri.WorldImagery",4,"Esri.WorldImagery",{"errorTileUrl":"","noWrap":false,"detectRetina":false}]},{"method":"addProviderTiles","args":["OpenTopoMap",5,"OpenTopoMap",{"errorTileUrl":"","noWrap":false,"detectRetina":false}]},{"method":"createMapPane","args":["polygon",420]},{"method":"addPolygons","args":[[[[{"lng":[20.5902474301049,20.4631750830992,20.6051819190374,21.0200403174764,20.9999898617472,20.6749967790636,20.6150004411728,20.1500159034105,19.9800004411701,19.9600016618732,19.4060819841367,19.3190588721571,19.4035498389543,19.5400272966371,19.371768833095,19.3044861182508,19.7380513851796,19.8016133968987,20.0707,20.2837545101819,20.52295,20.5902474301049],"lat":[41.8554041611336,41.5150890162753,41.0862263046852,40.8427269557259,40.580003973954,40.434999904943,40.1100068222594,39.624997666984,39.6949933945234,39.915005805006,40.2507734238225,40.7272301295536,41.4095657415355,41.7199860703128,41.8775475123707,42.1957451442078,42.6882473821656,42.5000934921908,42.5886300000001,42.3202595078151,42.2178700000001,41.8554041611336]}]],[[{"lng":[16.979666782304,16.9037541032673,16.3405843441504,16.5342676123804,16.2022982113374,16.0116638526127,15.137091912505,14.6324715511748,13.8064754574215,12.3764852230408,12.1530880062431,11.1648279150933,11.0485559424365,10.4427014502466,9.93244835779666,9.47996951664902,9.63293175623298,9.59422610844635,9.89606814946319,10.4020837744652,10.5445040218616,11.4264140153547,12.1413574561128,12.6207597184845,12.9326269873659,13.0258512712205,12.8841028174439,13.243357374737,13.5959456722644,14.3388977393247,14.9014473812541,15.253415561594,16.0296472510502,16.4992826677188,16.9602881201946,16.879982944413,16.979666782304],"lat":[48.1234970159763,47.7148656276283,47.7129019232012,47.4961709661691,46.852385972677,46.6836107448117,46.658702704447,46.4318173284695,46.5093061386912,46.7675591090699,47.1153931748265,46.9415794948127,46.7513585475463,46.8935462509974,46.920728054383,47.1028099635634,47.34760122333,47.5250580918203,47.5801968450757,47.3024876979392,47.5663992376538,47.523766181013,47.7030834010658,47.6723876002844,47.467645575544,47.6375835231358,48.2891458196879,48.4161148138291,48.8771719427371,48.5553052842072,48.9644017604458,49.0390742051076,48.7338990342079,48.7858080104451,48.5969823268506,48.4700133327095,48.1234970159763]}]],[[{"lng":[3.31497114422854,4.04707116050753,4.97399132652691,5.60697594567,6.15665815595878,6.04307335778111,5.78241743330091,5.67405195478483,4.79922163251581,4.28602298342508,3.58818444175569,3.1232515804258,2.65842207196027,2.51357303224614,3.31497114422854],"lat":[51.3457809515361,51.2672586126686,51.4750237086981,51.0372984889698,50.8037210150106,50.1280516627942,50.0903278672212,49.5294835475575,49.9853730332364,49.9074966497726,50.3789924180036,50.7803632676146,50.7968480495157,51.1485061712618,51.3457809515361]}]],[[{"lng":[22.657149692483,22.9448323910518,23.3323022803763,24.1006791521242,25.5692716814269,26.0651587256997,27.2423995297409,27.9701070492751,28.558081495892,28.0390950863847,27.673897739378,27.9967204119054,27.1357393734905,26.1170418637208,26.1061381365072,25.1972013689254,24.492644891058,23.6920736019923,22.9523771501665,22.8813737321974,22.3805257504246,22.5450118344096,22.4365946794613,22.6048014665713,22.9860185075885,22.5001566911803,22.4104464047216,22.657149692483],"lat":[44.2349230006613,43.8237853053471,43.8970108099047,43.7410513372479,43.6884447291747,43.9434937607513,44.1759860296324,43.8124681666752,43.7074616562581,43.2931716985742,42.5778923610062,42.0073587102878,42.1414848903013,41.8269046087246,41.3288988307278,41.2344859889305,41.583896185872,41.3090809189439,41.3379938828111,41.9992971868503,42.3202595078151,42.461362006188,42.5803211533239,42.8985187851611,43.211161200527,43.642814439461,44.0080634629,44.2349230006613]}]],[[{"lng":[19.0054862810101,19.3680299999999,19.1176100000001,19.5997600000001,19.4540000000001,19.21852,19.0316500000001,18.7064800000001,18.5599999999999,17.674921502359,17.2973734880345,16.9161564470173,16.4564429053489,16.2396602718845,15.750026075919,15.9593673031334,16.3181567725359,16.5349394060002,17.002146030351,17.8617834815264,18.5532141455917,19.0054862810101],"lat":[44.8602336696092,44.8630000000001,44.4230700000001,44.03847,43.5681000000001,43.52384,43.43253,43.20011,42.65,43.0285625270236,43.4463406438874,43.6677224798257,44.0412397324313,44.3511432968857,44.8187116562626,45.2337767604309,45.0041266953259,45.2116075709777,45.2337767604309,45.0677403834771,45.0815896673315,44.8602336696092]}]],[[{"lng":[23.4841276384498,24.450683628037,25.536353794057,25.7684326514798,26.5882792497904,26.4943314958838,27.1024597510945,28.176709425578,29.2295133806603,29.3715718930307,29.8962943865224,30.87390913262,30.9718359718131,30.7575338070987,31.3844722836637,31.7914241879622,31.7312728207745,32.4055985857512,32.693643019346,32.3045194841882,31.4976436703829,31.305200636528,31.5400183448623,31.7859981625716,30.927549269339,30.6194543800148,30.5551172218115,30.1573637224609,29.2549381853479,28.9928353207635,28.6176127458922,28.2416150245366,27.4540661964084,26.3379586117686,25.327787713327,24.5531063168395,24.0050777523842,23.5270707536844,23.5080021501687,23.1994938493862,23.7991988461334,23.8049349301178,23.527535841575,23.4841276384498],"lat":[53.9124976670411,53.9057022161948,54.2824234076025,54.8469625921751,55.1671756048717,55.6151069199776,55.7833137070877,56.1691299505788,55.9183442246664,55.6700906439362,55.7894632025304,55.5509764675034,55.081547756564,54.8117709417843,54.1570563828624,53.9746385768721,53.794029446012,53.618045355842,53.3514208034321,53.1327261419729,53.1674268662569,53.0739958766732,52.7420523138464,52.1016779648855,52.0423534206144,51.8228060980224,51.3195034857157,51.4161384141015,51.3682343613669,51.6020443792715,51.4277139349348,51.5722270778391,51.5923033717845,51.8322887233479,51.9106560329186,51.8884610052492,51.6174439560945,51.5784540879302,52.0236465521247,52.4869774440537,52.6910993516066,53.0897313503061,53.4701215684066,53.9124976670411]}]],[[{"lng":[9.59422610844635,9.63293175623298,9.47996951664902,9.93244835779666,10.4427014502466,10.3633781266786,9.92283654139038,9.18288170740306,8.96630577966781,8.48995242680132,8.31662967289438,7.75599205895983,7.27385094567666,6.84359297041451,6.50009972497043,6.02260949059354,6.037388950229,6.76871382002361,6.73657107913806,7.19220218265551,7.46675906742223,8.31730146651415,8.52261193200977,9.59422610844635],"lat":[47.5250580918203,47.34760122333,47.1028099635634,46.920728054383,46.8935462509974,46.4835712754099,46.3148994004092,46.440214748717,46.0369318711112,46.0051508652517,46.1636424830909,45.8244900579593,45.7769477402508,45.9911465521006,46.4296727565294,46.2729898138205,46.7257787135619,47.2877082383037,47.5418012558828,47.449765529971,47.6205819769118,47.6135798203363,47.8308275416913,47.5250580918203]}]],[[{"lng":[16.9602881201946,16.4992826677188,16.0296472510502,15.253415561594,14.9014473812541,14.3388977393247,13.5959456722644,13.0313289730434,12.5210242041612,12.4151908708274,12.2401111182226,12.9668367855432,13.3381319515603,14.0562276546882,14.3070133806006,14.5707182145861,15.0169958838587,15.4909721208397,16.2386267432386,16.1762532894623,16.7194759457144,16.8687691586057,17.5545670915511,17.649445021239,18.3929138526222,18.8531441586136,18.5549711442895,18.3999935238462,18.170498488038,18.1049727718919,17.9135115902505,17.8864848161618,17.5450069515771,17.1019848975389,16.9602881201946],"lat":[48.5969823268506,48.7858080104451,48.7338990342079,49.0390742051076,48.9644017604458,48.5553052842072,48.8771719427371,49.3070681829732,49.5474152695627,49.9691207952806,50.2663377956073,50.4840764430691,50.7332343613644,50.9269176295943,51.1172677679414,51.0023393825243,51.1066740993216,50.7847299261432,50.6977326523798,50.4226073268579,50.2157465683935,50.473973700556,50.3621459010764,50.04903839782,49.9886286484708,49.4962297633776,49.4950153672188,49.31500051533,49.2715147975564,49.0439834661753,48.9964928248991,48.9034752467737,48.8000190293254,48.8169688991171,48.5969823268506]}]],[[{"lng":[9.92190636560923,9.9395797054529,10.9501123389205,10.9394669938685,11.9562524756433,12.5184403825467,13.6474670752595,14.1196863135426,14.3533154639342,14.0745211117194,14.4375997250022,14.6850264828157,14.6070984229196,15.0169958838588,14.5707182145861,14.3070133806007,14.0562276546883,13.3381319515604,12.9668367855433,12.2401111182227,12.4151908708275,12.5210242041613,13.0313289730435,13.5959456722646,13.2433573747371,12.8841028174439,13.0258512712205,12.9326269873661,12.6207597184845,12.1413574561129,11.4264140153549,10.5445040218616,10.4020837744653,9.89606814946319,9.59422610844638,8.5226119320098,8.3173014665141,7.46675906742229,7.59367638513106,8.09927859867486,6.65822960778371,6.18632042809418,6.24275109215699,6.04307335778111,6.15665815595878,5.98865807457781,6.58939659997083,6.84286950036238,7.0920532568739,6.90513960127413,7.10042483890527,7.93623945479396,8.12170617028949,8.80073449060467,8.57211795414537,8.52622928227021,9.28204878097114,9.92190636560923],"lat":[54.983104153048,54.5966419541533,54.3636070827332,54.0086933457526,54.1964855007012,54.470370591848,54.0755109727059,53.757029120491,53.2481712917131,52.9812625189253,52.6248501654083,52.0899474147552,51.74518809672,51.1066740993217,51.0023393825244,51.1172677679414,50.9269176295944,50.7332343613643,50.4840764430692,50.2663377956072,49.9691207952806,49.5474152695627,49.3070681829732,48.8771719427372,48.416114813829,48.2891458196879,47.637583523136,47.467645575544,47.6723876002844,47.7030834010658,47.5237661810131,47.5663992376538,47.3024876979392,47.5801968450757,47.5250580918202,47.8308275416913,47.6135798203363,47.6205819769119,48.3330191107037,49.0177835150034,49.2019583196916,49.4638028021145,49.9022256536787,50.1280516627942,50.8037210150106,51.8516157090251,51.8520291204834,52.2284402532975,53.1440432806449,53.4821621771306,53.6939321966627,53.7482958034338,53.5277924668443,54.0207856309089,54.3956464707541,54.9627436387252,54.8308653835163,54.983104153048]}]],[[{"lng":[12.6900061377556,12.0899910824147,11.0435433285042,10.9039136084516,12.3709041683533,12.6900061377556],"lat":[55.6099909531808,54.8000145534379,55.3648637966043,55.7799547389887,56.1114073757088,55.6099909531808]}],[{"lng":[10.9121818376184,10.66780398931,10.369992710012,9.64998497888931,9.92190636560917,9.28204878097114,8.52622928227024,8.12031090661759,8.08997684086225,8.25658165857126,8.54343753422339,9.42446902836761,9.77555870935856,10.5800057308462,10.5461059912627,10.2500000342302,10.369992710012,10.9121818376184],"lat":[56.4586213242779,56.0813833685472,56.1900072292247,55.4699994981021,54.9831041530481,54.8308653835162,54.962743638725,55.5177226833236,56.5400117051376,56.8099693874303,57.1100027533169,57.1720661484995,57.4479407822897,57.7300165879549,57.2157327337862,56.8900161810505,56.6099815944608,56.4586213242779]}]],[[{"lng":[-9.03481767418025,-8.98443315269567,-9.39288367353065,-7.97818966310831,-6.75449174643676,-5.4118863590616,-4.34784277995578,-3.51753170410609,-1.90135128417776,-1.50277096191053,0.338046909190581,0.701590610363894,1.82679324708715,2.98599897625846,3.03948408368055,2.09184166831218,0.810524529635188,0.721331007499401,0.106691521819869,-0.278711310212941,0.111290724293838,-0.467123582349103,-0.683389451490598,-1.43838212727485,-2.14645260253812,-3.41578080892339,-4.36890092611472,-4.99521928549221,-5.37715979656146,-5.8664322575009,-6.23669389487218,-6.5201908024254,-7.45372555177809,-7.53710547528102,-7.16650794109986,-7.0292811751488,-7.37409216961632,-7.09803666831313,-7.49863237143973,-7.06659155926353,-7.02641313315659,-6.86401994467939,-6.85112667482255,-6.38908769370092,-6.66860551596766,-7.25130896649082,-7.4225129866738,-8.01317460776991,-8.26385698081779,-8.67194576662672,-9.03481767418025],"lat":[41.8805705836597,42.5927751735063,43.0266246608127,43.748337714201,43.5679094508539,43.5742398138097,43.403449205085,43.4559007838613,43.4228020289783,43.0340143906304,42.5795460068395,42.7957343613326,42.3433847112657,42.4730150416699,41.8921202662769,41.2260885686831,41.0147319606093,40.6783183863892,40.123933620762,39.3099781357327,38.738514309233,38.2923658310412,37.6423538274578,37.4430636663242,36.6741441920373,36.6588996445112,36.6778390569462,36.3247081568796,35.9468500839615,36.0298165960061,36.3676771103303,36.9429133163873,37.0977875839661,37.4289043238762,37.8038943548022,38.0757640650898,38.3730585800649,39.0300727402238,39.6295710312418,39.7118915878828,40.1845242376242,40.3308718938748,41.1110826686175,41.3818154973947,41.8833869492196,41.918346055665,41.7920746933598,41.7908861354171,42.2804686549503,42.134689439455,41.8805705836597]}]],[[{"lng":[24.3128625831146,24.4289278500422,24.0611983578532,23.4265600928767,23.3397953630586,24.6042143083762,25.8641890805166,26.9491357764845,27.9811141293532,28.1316992530517,27.4201664568249,27.7166858253157,27.2881848487515,26.4635323422378,25.6028096859844,25.1645935401493,24.3128625831146],"lat":[57.793423570377,58.3834133978533,58.2573745794934,58.6127534043646,59.1872403021534,59.465853786855,59.6110903998113,59.4458033311258,59.4753880886129,59.3008251003309,58.7245812038442,57.7918991156244,57.4745283067038,57.4763886582663,57.8475287949866,57.9701569688152,57.793423570377]}]],[[{"lng":[28.5919295590432,28.4459436378187,29.9774263852206,29.0545886573523,30.21765,29.544429559047,30.4446846860037,30.0358724301427,31.5160921567111,31.1399910824909,30.2111072120444,28.0699975928953,26.255172967237,24.4966239763445,22.8696948584995,22.2907637875336,21.3222440935193,21.5448661638327,21.0592110531537,21.5360294939108,22.442744174904,24.7305115088975,25.3980676612439,25.2940430030404,23.9033785336338,23.5658797543356,23.5394730974344,21.9785347836261,20.6455928890895,21.2449361508107,22.3562378272474,23.6620495948308,24.7356791521267,25.6892126807764,26.1796220232262,27.7322921078679,29.015572950972,28.5919295590432],"lat":[69.0647769232867,68.364612942164,67.6982970241927,66.9442862006219,65.80598,64.9486715765905,64.2044534369391,63.5528136257386,62.8676874864129,62.3576927761244,61.7800277777497,60.5035165472758,60.4239606797625,60.0573163926517,59.8463731960362,60.3919212917415,60.7201699896595,61.7053294948718,62.6073932969587,63.1897350124559,63.8178103705313,64.9023436550408,65.1114265000937,65.5343464219705,66.0069273952796,66.3960509304374,67.9360086127353,68.6168456081807,69.1062472602009,69.3704430202931,68.8417414415149,68.8912474636505,68.6495567898215,69.092113755969,69.8252989773261,70.1641930202963,69.766491197378,69.0647769232867]}]],[[{"lng":[9.56001631026913,9.22975223149177,8.77572309737536,8.54421268070783,8.74600914880759,9.3900008480289,9.56001631026913],"lat":[42.1524919703796,41.3800068222644,41.5836119654944,42.2565166285831,42.628121853194,43.0099848496147,42.1524919703796]}],[{"lng":[3.58818444175571,4.28602298342514,4.79922163251575,5.67405195478489,5.89775923017638,6.18632042809421,6.65822960778354,8.09927859867477,7.59367638513106,7.46675906742223,7.19220218265554,6.73657107913809,6.76871382002363,6.03738895022897,6.02260949059357,6.50009972497045,6.84359297041456,6.80235517744566,7.09665245934784,6.74995527510171,7.00756229007666,7.54959638838616,7.43518476729184,6.52924523278307,4.5569625179314,3.10041059735272,2.98599897625849,1.82679324708718,0.701590610363922,0.338046909190581,-1.50277096191047,-1.90135128417774,-1.38422522623296,-1.19379757323736,-2.22572424967379,-2.96327612955957,-4.49155493815948,-4.59234981934475,-3.29581397135775,-1.61651078938493,-1.93349402506325,-0.98946895995536,1.33876102052275,1.6390010921385,2.51357303224617,2.65842207196033,3.12325158042572,3.58818444175571],"lat":[50.3789924180036,49.9074966497726,49.9853730332363,49.5294835475574,49.4426671413072,49.4638028021145,49.2019583196916,49.0177835150034,48.3330191107037,47.6205819769119,47.449765529971,47.5418012558829,47.2877082383037,46.7257787135619,46.2729898138205,46.4296727565294,45.9911465521007,45.7085798203287,45.3330988632959,45.0285179713676,44.2547667506614,44.1279011093848,43.6938449163492,43.1288923203184,43.3996509873116,43.0752005071671,42.4730150416699,42.3433847112657,42.7957343613326,42.5795460068396,43.0340143906305,43.4228020289783,44.0226103785902,46.0149177109549,47.0643626979382,47.570326646508,47.9549543320564,48.6841604681269,48.9016924098596,48.6444212916946,49.7763418646158,49.3473758001609,50.1271731634453,50.9466063502975,51.1485061712619,50.7968480495157,50.7803632676145,50.3789924180036]}]],[[{"lng":[-5.6619486149219,-6.19788489422098,-6.953730231138,-7.57216793459108,-7.36603064617879,-7.57216793459108,-6.73384701173615,-5.6619486149219],"lat":[54.5546031764839,53.8675650091633,54.0737022975756,54.059956366586,54.5958409694527,55.1316222194549,55.1728600124238,54.5546031764839]}],[{"lng":[-3.00500484863528,-4.07382849772802,-3.05500179687766,-1.95928056477692,-2.2199881656893,-3.11900305827112,-2.08500932454302,-2.00567567967386,-1.11499101399221,-0.4304849918542,0.184981316742039,0.469976840831777,1.68153079591474,1.55998782716438,1.05056155763091,1.4498653499503,0.550333693045502,-0.78751746255864,-2.48999752441438,-2.95627397298404,-3.61744808594233,-4.54250790039924,-5.24502315919113,-5.7765669417453,-4.30998979330184,-3.41485063314212,-3.42271946710832,-4.98436723471087,-5.26729570150889,-4.22234656413485,-4.77001339356411,-4.57999915202691,-3.09383067378866,-3.09207963704711,-2.94500851074434,-3.61470082543303,-3.63000545898933,-4.844169073903,-5.08252661784923,-4.71911210775664,-5.04798092286211,-5.58639767091114,-5.64499874513018,-6.14998084148635,-5.78682471355529,-5.00999874512758,-4.21149451335356,-3.00500484863528],"lat":[58.6350001084663,57.5530248073553,57.6900190293609,57.6847997096995,56.8700174017535,55.9737930365155,55.9099984808513,55.8049028503502,54.6249864772654,54.4643761257022,53.325014146531,52.929999498092,52.739520168664,52.099998480836,51.8067605657957,51.289427802122,50.7657388372759,50.7749889186562,50.5000186224312,50.696879991247,50.2283556178727,50.3418370631857,49.9599999049811,50.1596776393568,51.2100011256892,51.4260086126692,51.4268481674061,51.593466091511,51.9914004583746,52.3013556992614,52.8400049912556,53.4950037705552,53.4045474006697,53.4044408229636,53.9849997015467,54.6009367732926,54.615012925833,54.7909711777868,55.0616006536994,55.5084726019435,55.7839855007075,55.3111461452368,56.2750149603448,56.7850096706335,57.8188483750646,58.6300133327501,58.5508450384792,58.6350001084663]}]],[[{"lng":[23.699980096133,24.2466650733487,25.0250154965289,25.7692077979642,25.7450232276516,26.2900028826017,26.1649975928877,24.7249821306423,24.7350073585069,23.5149784685281,23.699980096133],"lat":[35.7050043808355,35.3680223658602,35.424995632462,35.3540180527091,35.1799976669662,35.2999903427479,35.0049954290098,34.9199876978896,35.0849905461976,35.279991563451,35.7050043808355]}],[{"lng":[26.6041955909363,26.2946020850758,26.0569421729655,25.4476770362442,24.9258484229609,23.7148112322008,24.4079988949641,23.8999678891026,23.3429993018608,22.813987664489,22.6262988624048,22.8497477556348,23.3500272966526,22.9730993995155,23.530016310325,24.0250248552489,24.0400110206136,23.1150028825892,23.4099719581111,22.7749719581086,23.1542252946986,22.4900281104511,21.6700264828437,21.2950106137016,21.1200342139613,20.7300321794546,20.2177120297129,20.1500159034105,20.6150004411728,20.6749967790636,20.9999898617473,21.0200403174764,21.674160597427,22.0553776384443,22.597308383889,22.7617700000001,22.9523771501666,23.6920736019925,24.492644891058,25.1972013689255,26.1061381365072,26.1170418637209,26.6041955909363],"lat":[41.5621145696611,40.9362612981743,40.8241234401008,40.8525454778615,40.9470616725232,40.6871292180951,40.1249929876241,39.9620055201756,39.9609978297458,40.4760051539666,40.2565611842392,39.6593108180258,39.1900112981673,38.9709032252497,38.5100011256385,38.2199929876165,37.6550145533694,37.9200112981622,37.4099907496574,37.3050100774566,36.4225058049921,36.4100001083775,36.8449864771942,37.6449893255047,38.3103233912627,38.7699852564988,39.3402346868396,39.624997666984,40.1100068222594,40.4349999049431,40.580003973954,40.8427269557259,40.931274522458,41.1498658310527,41.1304871689432,41.3048000000001,41.3379938828112,41.3090809189439,41.583896185872,41.2344859889307,41.3288988307278,41.8269046087247,41.5621145696611]}]],[[{"lng":[18.82983808765,19.0727689958542,19.3904757015846,19.0054862810101,18.5532141455917,17.8617834815264,17.002146030351,16.5349394060002,16.3181567725359,15.9593673031334,15.750026075919,16.2396602718845,16.4564429053489,16.9161564470173,17.2973734880345,17.674921502359,18.5599999999999,18.4500163103048,17.5099703304833,16.9300057308716,16.0153845557377,15.1744539730521,15.3762504411518,14.9203092790405,14.9016024105509,14.25874759284,13.952254672917,13.6569755388012,13.6794031104158,13.7150598486973,14.4119682145855,14.5951094906279,14.935243767973,15.3276745947974,15.3239538916724,15.6715295752676,15.7687329444086,16.5648083838649,16.8825150895954,17.6300663591296,18.4560624528829,18.82983808765],"lat":[45.9088776718918,45.5215111354321,45.2365156113424,44.8602336696092,45.0815896673315,45.0677403834771,45.2337767604309,45.2116075709777,45.0041266953259,45.2337767604309,44.8187116562626,44.3511432968857,44.0412397324313,43.6677224798257,43.4463406438874,43.0285625270236,42.65,42.4799913600293,42.8499946152392,43.2099984808004,43.5072154811272,44.2431912298279,44.3179153509221,44.7384839951295,45.0760602890761,45.2337767604309,44.8021235214969,45.136935126316,45.484149074885,45.5003237981924,45.4661656764474,45.6349409043128,45.4716950547028,45.4523163925933,45.7317825384277,45.8341535507979,46.2381082220235,46.5037509222198,46.3806318222844,45.9517691106941,45.7594811061361,45.9088776718918]}]],[[{"lng":[16.2022982113374,16.5342676123804,16.3405843441504,16.9037541032673,16.979666782304,17.4884729346498,17.85713260262,18.6965128923369,18.7770247738477,19.1743648617399,19.6613635596585,19.7694706560131,20.2390543962493,20.4735620459899,20.8012939795849,21.8722363624017,22.0856083513349,22.6408199398788,22.7105314470405,22.0997676937828,21.6265149268539,21.0219523454712,20.2201924984628,19.5960445492416,18.82983808765,18.4560624528829,17.6300663591296,16.8825150895953,16.5648083838649,16.3705049984474,16.2022982113374],"lat":[46.852385972677,47.4961709661691,47.7129019232012,47.7148656276283,48.1234970159763,47.8674661321862,47.7584288600504,47.8809536810144,48.0817682969006,48.1113788926039,48.2666148952087,48.2026911484636,48.3275672470969,48.5628500433218,48.6238540716424,48.31997081155,48.4222643092718,48.1502395696874,47.8821939153894,47.6724392767167,46.9942377793182,46.3160879583519,46.1274689804866,46.1717298447445,45.9088776718919,45.7594811061361,45.9517691106942,46.3806318222844,46.5037509222198,46.8413272161665,46.852385972677]}]],[[{"lng":[-6.19788489422099,-6.03298539877761,-6.78885657391085,-8.56161658368356,-9.97708574059027,-9.16628251793078,-9.68852454267245,-8.32798743329201,-7.57216793459106,-7.36603064617879,-7.57216793459106,-6.95373023113807,-6.19788489422099],"lat":[53.8675650091634,53.1531641709444,52.2601179062923,51.6693012558994,51.8204548203531,52.8646288112427,53.8813626165853,54.6645189479686,55.1316222194549,54.5958409694527,54.059956366586,54.0737022975756,53.8675650091634]}]],[[{"lng":[-14.5086954411292,-14.7396374170416,-13.6097322249798,-14.9098337467949,-17.7944380355434,-18.656245896875,-19.9727546859428,-22.7629719711102,-21.7784842595177,-23.9550439112191,-22.1844026351704,-22.2274232650533,-24.3261840479393,-23.6505146957231,-22.1349224512509,-20.5762837386795,-19.0568416000016,-17.7986238265591,-16.1678189762921,-14.5086954411292],"lat":[66.4558922390314,65.8087482774403,65.1266710476199,64.3640819362887,63.6787490912339,63.4963829616758,63.6436349554915,63.9601789414954,64.4021157904555,64.8911298692335,65.0849681667603,65.3785936550427,65.6111892767885,66.2625190293952,66.4104686550469,65.7321121283514,66.2766008571948,65.9938532579098,66.5267923041359,66.4558922390314]}]],[[{"lng":[15.5203760108138,15.1602429541717,15.309897902089,15.0999882341195,14.335228712632,13.8267326188799,12.4310038591088,12.5709436377551,13.7411564470046,14.7612492204462,15.5203760108138],"lat":[38.2311550969915,37.4440455185378,37.1342194687318,36.6199872909954,36.9966309677548,37.1045313583802,37.6129499374838,38.1263811305197,38.0349655217954,38.1438736028505,38.2311550969915]}],[{"lng":[9.21001183435627,9.80997521326498,9.66951867029567,9.21481774255949,8.80693566247973,8.42830244307711,8.38825320805094,8.15999840661766,8.70999067550011,9.21001183435627],"lat":[41.2099913600242,40.5000088567661,39.1773764104718,39.2404733343001,38.9066177434785,39.1718470322166,40.3783108587188,40.9500072291638,40.8999844427052,41.2099913600242]}],[{"lng":[12.3764852230408,13.8064754574216,13.6981099789055,13.9376302425783,13.1416064795543,12.3285811703063,12.3838749528586,12.2614534847592,12.5892370947865,13.5269059587225,14.029820997787,15.142569614328,15.9261910336019,16.1698970882904,15.8893457373778,16.7850016618606,17.5191687354312,18.3766874528826,18.4802470231954,18.2933850440281,17.7383801612133,16.8695959815223,16.4487431169373,17.1714896989715,17.0528406104293,16.6350883317818,16.1009607276131,15.6840869483145,15.6879626807363,15.8919812354247,16.1093323096443,15.7188135108146,15.4136125016988,14.9984957210982,14.7032682634148,14.0606718278653,13.6279850602854,12.8880819027304,12.1066825700449,11.1919063656142,10.5119478695178,10.200028924204,9.70248823409781,8.88894616052687,8.42856082523858,7.8507666357832,7.43518476729184,7.54959638838616,7.00756229007666,6.74995527510171,7.09665245934784,6.80235517744566,6.84359297041456,7.27385094567668,7.75599205895983,8.31662967289438,8.4899524268013,8.96630577966783,9.18288170740311,9.92283654139035,10.3633781266787,10.4427014502466,11.0485559424365,11.1648279150933,12.1530880062431,12.3764852230408],"lat":[46.7675591090699,46.5093061386912,46.0167780625174,45.5910159368647,45.7366917994954,45.3817780625149,44.8853742539191,44.600482082694,44.0913658717545,43.5877273626379,42.7610077988325,41.9551396754569,41.9613150091157,41.7402949082034,41.5410822617182,41.1796056178366,40.8771434596322,40.3556249049427,40.1688662786398,39.8107744410732,40.2776710068303,40.4422346054639,39.7954007024665,39.4246998154207,38.9028712021373,38.8435724960824,37.9858987493342,37.908849188787,38.2145928004419,38.7509424911992,38.9645470240777,39.5440723740149,40.0483568385352,40.1729487167909,40.6045502792926,40.7863479680954,41.1882872584617,41.2530895045556,41.7045348170574,42.3554253199897,42.9314625107472,43.9200068222746,44.0362787949313,44.3663361679795,44.2312281357524,43.7671479355552,43.6938449163492,44.1279011093848,44.2547667506614,45.0285179713676,45.3330988632959,45.7085798203287,45.9911465521007,45.7769477402508,45.8244900579593,46.1636424830909,46.0051508652517,46.0369318711112,46.440214748717,46.3148994004092,46.4835712754098,46.8935462509974,46.7513585475464,46.9415794948127,47.1153931748264,46.7675591090699]}]],[[{"lng":[20.76216,20.7173100000001,20.5902300000001,20.52295,20.2837400000001,20.0707,20.2575800000001,20.49679,20.63508,20.81448,20.95651,21.1433950000001,21.27421,21.43866,21.63302,21.77505,21.66292,21.5433200000001,21.5766359894021,21.3527000000001,20.76216],"lat":[42.05186,41.84711,41.8554100000001,42.2178700000001,42.3202500000001,42.5886300000001,42.8127500000001,42.88469,43.21671,43.2720500000001,43.1309400000001,43.0686850000001,42.9095900000001,42.8625499999999,42.67717,42.6827,42.43922,42.3202500000001,42.2452243970619,42.2068,42.05186]}]],[[{"lng":[22.7310986670927,22.6510518734725,22.7577637061553,22.3157235043306,21.2684489275035,21.0558004086224,22.2011568539395,23.87826378754,24.8606844418408,25.0009342790809,25.5330465023903,26.4943314958838,26.5882792497904,25.7684326514798,25.536353794057,24.450683628037,23.4841276384498,23.2439872575895,22.7310986670927],"lat":[54.3275369329933,54.5827409938667,54.8565744085814,55.0152985703659,55.1904816758353,56.0310763617111,56.3378018255795,56.2736713731053,56.3725283880796,56.1645307481048,56.100296942766,55.6151069199776,55.1671756048717,54.8469625921751,54.2824234076025,53.9057022161948,53.9124976670411,54.2205667181491,54.3275369329933]}]],[[{"lng":[6.04307335778111,6.24275109215699,6.18632042809418,5.8977592301764,5.67405195478483,5.78241743330091,6.04307335778111],"lat":[50.1280516627942,49.9022256536787,49.4638028021145,49.442667141307,49.5294835475575,50.0903278672212,50.1280516627942]}]],[[{"lng":[21.0558004086224,21.090423618258,21.5818664893537,22.5243412614929,23.3184529965221,24.1207296078534,24.3128625831146,25.1645935401493,25.6028096859844,26.4635323422378,27.2881848487515,27.7700159034409,27.8552820167225,28.176709425578,27.1024597510945,26.4943314958838,25.5330465023903,25.0009342790809,24.8606844418408,23.87826378754,22.2011568539395,21.0558004086224],"lat":[56.0310763617111,56.7838727891229,57.4118706325499,57.7533743353508,57.0062364772749,57.0256926540328,57.793423570377,57.9701569688152,57.8475287949866,57.4763886582663,57.4745283067038,57.2442581244112,56.7593264837843,56.1691299505788,55.7833137070877,55.6151069199776,56.100296942766,56.1645307481048,56.3725283880796,56.2736713731053,56.3378018255795,56.0310763617111]}]],[[{"lng":[26.6193367855978,26.8578235206248,27.5225374691952,28.2595467465418,28.6708911475852,29.122698195113,29.0508679542273,29.4151351254527,29.5596741065731,29.9088517595693,29.8382100766263,30.0246586443354,29.7599719581364,29.1706539242799,29.0721069678993,28.8629724464141,28.9337174822216,28.6599874203716,28.4852694027928,28.233553501099,28.0544429867754,28.1600179379477,28.128030226359,27.5511662126848,27.2338729184127,26.9241760596876,26.6193367855978],"lat":[48.2207262233335,48.3682107610945,48.4671194525011,48.1555622422134,48.1181485052341,47.8490951605065,47.5102269557525,47.3466452093326,46.9285828720913,46.6743606634315,46.5253258327017,46.423936672545,46.3499876979354,46.3792623968287,46.5176777207225,46.4378893092638,46.2588304713725,45.9399868841316,45.5969070501459,45.4882831894684,45.9445860866056,46.3715626084172,46.8104763860883,47.4051170924708,47.8267709417564,48.123264472031,48.2207262233335]}]],[[{"lng":[20.5902300000001,20.7173100000001,20.76216,21.3527000000001,21.5766359894021,21.9170800000001,22.3805257504247,22.8813737321973,22.9523771501665,22.76177,22.597308383889,22.0553776384443,21.674160597427,21.0200403174764,20.60518,20.46315,20.5902300000001],"lat":[41.8554100000001,41.84711,42.05186,42.2068,42.2452243970619,42.30364,42.3202595078151,41.9992971868504,41.3379938828112,41.3048000000001,41.1304871689432,41.1498658310527,40.931274522458,40.8427269557259,41.0862200000001,41.5150900000001,41.8554100000001]}]],[[{"lng":[19.8016133968987,19.7380513851796,19.3044900000001,19.3717700000001,19.16246,18.88214,18.45,18.5599999999999,18.7064800000001,19.0316500000001,19.21852,19.48389,19.63,19.9585700000001,20.3398000000001,20.2575800000001,20.0707,19.8016133968987],"lat":[42.5000934921908,42.6882473821656,42.1957400000001,41.8775499999999,41.95502,42.28151,42.48,42.65,43.20011,43.43253,43.52384,43.35229,43.2137799702705,43.1060400000001,42.89852,42.8127500000001,42.5886300000001,42.5000934921908]}]],[[{"lng":[6.07418257002092,6.90513960127413,7.0920532568739,6.84286950036238,6.58939659997083,5.98865807457781,6.15665815595878,5.60697594567,4.97399132652691,4.04707116050753,3.31497114422854,3.83028852704314,4.70599734866119,6.07418257002092],"lat":[53.5104033473781,53.4821621771306,53.1440432806449,52.2284402532975,51.8520291204834,51.8516157090251,50.8037210150106,51.0372984889698,51.4750237086981,51.2672586126686,51.3457551133199,51.620544542032,53.0917984075978,53.5104033473781]}]],[[{"lng":[28.1655473162029,31.2934184099655,30.0054350115228,31.1010787289751,29.3995805193329,28.5919295590432,29.015572950972,27.7322921078679,26.1796220232263,25.6892126807764,24.7356791521267,23.6620495948308,22.3562378272474,21.2449361508107,20.6455928890896,20.0252689958579,19.8785596045813,17.9938684424644,17.7291817562653,16.7688786149855,16.1087121924568,15.1084114925831,13.5556897315091,13.9199052263022,13.5719161312488,12.5799353369739,11.9305692887942,11.9920642432215,12.6311466813752,12.3003658382749,11.4682719255112,11.0273686051969,10.3565568376161,8.38200035974364,7.0487484066133,5.66583540205042,5.30823449059073,4.99207807782901,5.91290042483789,8.55341108565577,10.5277091813668,12.3583467953064,14.7611458675816,16.435927361729,19.1840283545785,21.3784163754206,23.0237423031616,24.5465434099385,26.3700496762218,28.1655473162029],"lat":[71.1854743516805,70.4537877468599,70.1862588568849,69.5580801459449,69.1569160020631,69.0647769232867,69.766491197378,70.1641930202963,69.8252989773262,69.092113755969,68.6495567898214,68.8912474636505,68.841741441515,69.3704430202931,69.1062472602009,69.0651386583127,68.4071943223726,68.5673912624773,68.0105518663162,68.0139366726314,67.3024555528369,66.1938668890954,64.7870276963815,64.4454206407161,64.0491140814697,64.0662189805583,63.128317572677,61.8003624538566,61.2935716823701,60.1179328477301,59.432393296946,58.8561494004594,59.4698070339254,58.3132884792333,58.0788841823573,58.5881554225937,59.6632319199938,61.9709980332843,62.6144729681827,63.4540082871965,64.4860383164975,65.8797258571932,67.8106415879951,68.5632054714617,69.8174441596178,70.2551693793461,70.2020718451663,71.0304967312372,70.9862617051954,71.1854743516805]}],[{"lng":[24.72412,22.49032,20.72601,21.41611,20.8119,22.88426,23.28134,24.72412],"lat":[77.85385,77.44493,77.67704,77.93504,78.25463,78.4549400000001,78.07954,77.85385]}],[{"lng":[18.2518300000001,21.54383,19.02737,18.4717200000001,17.5944100000001,17.1182,15.91315,13.76259,14.66956,13.1706,11.22231,10.44453,13.1707700000001,13.71852,15.1428200000001,15.52255,16.99085,18.2518300000001],"lat":[79.70175,78.95611,78.5626,77.82669,77.63796,76.80941,76.77045,77.38035,77.73565,78.02493,78.8693,79.65239,80.01046,79.66039,79.67431,80.01608,80.05086,79.70175]}],[{"lng":[25.4476253598119,27.4075057309135,25.9246505062982,23.0244657732136,20.0751884294519,19.8972664730709,18.4622636247579,17.3680151709775,20.4559920590107,21.9079447771154,22.9192525570674,25.4476253598119],"lat":[80.4073403998945,80.0564057482005,79.5178339708546,79.4000117052291,79.5668232286673,79.8423619656475,79.8598802761944,80.318896186027,80.5981556261322,80.3576793484621,80.6571442735935,80.4073403998945]}]],[[{"lng":[15.0169958838587,14.6070984229195,14.6850264828157,14.4375997250022,14.0745211117195,14.3533154639341,14.1196863135426,14.8029004248735,16.3634770036557,17.6228316586087,18.6208585954616,18.6962545101755,19.6606400896064,20.8922445004186,22.7310986670927,23.2439872575895,23.4841276384498,23.527535841575,23.8049349301178,23.7991988461334,23.1994938493862,23.5080021501687,23.5270707536844,24.0299857927489,23.9227571957433,23.4265084164444,22.5184501482116,22.7764188982126,22.5581376482118,21.6078080583642,20.8879553565384,20.4158394711199,19.8250228207269,19.3207125179905,18.9095748226763,18.8531441586136,18.3929138526222,17.649445021239,17.5545670915511,16.8687691586057,16.7194759457144,16.1762532894623,16.2386267432386,15.4909721208397,15.0169958838587],"lat":[51.1066740993216,51.74518809672,52.0899474147552,52.6248501654084,52.9812625189254,53.248171291713,53.757029120491,54.0507062852057,54.5131586777857,54.8515359564329,54.6826056992708,54.4387187770693,54.4260838893739,54.3125249294125,54.3275369329933,54.2205667181491,53.9124976670411,53.4701215684066,53.0897313503061,52.6910993516066,52.4869774440537,52.0236465521247,51.5784540879302,50.7054066025752,50.4248810898788,50.3085057643575,49.4767735866197,49.0273953314096,49.0857380234671,49.4701073268541,49.3287722845358,49.4314533554998,49.2171253525692,49.5715740016592,49.4358458522446,49.4962297633776,49.9886286484708,50.04903839782,50.3621459010764,50.473973700556,50.2157465683935,50.4226073268579,50.6977326523798,50.7847299261432,51.1066740993216]}]],[[{"lng":[-9.03481767418025,-8.67194576662672,-8.26385698081779,-8.01317460776991,-7.4225129866738,-7.25130896649082,-6.66860551596766,-6.38908769370092,-6.85112667482255,-6.86401994467939,-7.02641313315659,-7.06659155926353,-7.49863237143973,-7.09803666831313,-7.37409216961632,-7.0292811751488,-7.16650794109986,-7.53710547528102,-7.45372555177809,-7.85561316571199,-8.38281612795369,-8.89885698082033,-8.74610144696555,-8.83999752443988,-9.28746375165522,-9.52657060386971,-9.44698889814023,-9.04830522300843,-8.97735348147168,-8.7686840478771,-8.79085323733031,-8.99078935386757,-9.03481767418025],"lat":[41.8805705836597,42.134689439455,42.2804686549503,41.7908861354171,41.7920746933598,41.918346055665,41.8833869492196,41.3818154973947,41.1110826686175,40.3308718938748,40.1845242376242,39.7118915878828,39.6295710312418,39.0300727402238,38.3730585800649,38.0757640650898,37.8038943548022,37.4289043238762,37.0977875839661,36.8382685409963,36.9788801132625,36.8688093124808,37.6513455266766,38.2662433945176,38.3584858261586,38.7374291041549,39.3920661484284,39.7550930852788,40.1593061386658,40.7606389430302,41.1843340113913,41.5434593776036,41.8805705836597]}]],[[{"lng":[22.7105314470405,23.1422363624068,23.7609582862374,24.4020561052504,24.8663171729606,25.207743361113,25.9459411964024,26.1974503923669,26.6193367855978,26.9241760596876,27.2338729184127,27.5511662126848,28.128030226359,28.1600179379477,28.0544429867754,28.233553501099,28.6797794939394,29.1497249692017,29.6032890154274,29.6265434099588,29.1416117693318,28.8378577003202,28.558081495892,27.9701070492751,27.2423995297409,26.0651587256997,25.5692716814269,24.1006791521242,23.3323022803763,22.9448323910518,22.657149692483,22.4740084164406,22.7057255388374,22.4590222510759,22.1450879249028,21.5620227393536,21.4835262387022,20.8743127784134,20.76217492034,20.2201924984628,21.0219523454712,21.6265149268539,22.0997676937828,22.7105314470405],"lat":[47.8821939153894,48.0963410508069,47.9855984564055,47.9818777532804,47.7375257431883,47.8910564235275,47.9871487493742,48.2208812526303,48.2207262233335,48.123264472031,47.8267709417564,47.4051170924708,46.8104763860883,46.3715626084172,45.9445860866056,45.4882831894684,45.3040308701317,45.4649254420725,45.2933080104311,45.0353909368624,44.820210272799,44.9138738063281,43.7074616562581,43.8124681666752,44.1759860296324,43.9434937607513,43.6884447291747,43.7410513372479,43.8970108099047,43.8237853053471,44.2349230006613,44.4092276067818,44.578002834647,44.7025171982543,44.4784223496206,44.7689472519655,45.1811701523578,45.4163754339342,45.7345730657714,46.1274689804866,46.3160879583519,46.9942377793182,47.6724392767167,47.8821939153894]}]],[[{"lng":[20.8743127784134,21.4835262387022,21.5620227393537,22.1450879249029,22.459022251076,22.7057255388374,22.4740084164407,22.6571496924831,22.4104464047216,22.5001566911802,22.9860185075885,22.6048014665714,22.4365946794614,22.5450118344096,22.3805257504247,21.9170800000001,21.5766359894021,21.5433200000001,21.66292,21.77505,21.63302,21.43866,21.27421,21.1433950000001,20.95651,20.81448,20.63508,20.49679,20.2575800000001,20.3398000000001,19.9585700000001,19.63,19.48389,19.21852,19.4540000000001,19.5997600000001,19.1176100000001,19.3680299999999,19.0054800000001,19.3904757015846,19.0727689958542,18.8298200000001,19.5960445492416,20.2201924984629,20.76217492034,20.8743127784134],"lat":[45.4163754339343,45.1811701523579,44.7689472519656,44.4784223496206,44.7025171982544,44.578002834647,44.4092276067818,44.2349230006614,44.0080634629001,43.642814439461,43.2111612005271,42.8985187851611,42.580321153324,42.461362006188,42.3202595078151,42.30364,42.2452243970619,42.3202500000001,42.43922,42.6827,42.67717,42.8625499999999,42.9095900000001,43.0686850000001,43.1309400000001,43.2720500000001,43.21671,42.88469,42.8127500000001,42.89852,43.1060400000001,43.2137799702705,43.35229,43.52384,43.5681000000001,44.03847,44.4230700000001,44.8630000000001,44.86023,45.2365156113424,45.5215111354321,45.9088800000001,46.1717298447446,46.1274689804866,45.7345730657715,45.4163754339343]}]],[[{"lng":[18.8531441586136,18.9095748226763,19.3207125179905,19.8250228207269,20.4158394711199,20.8879553565384,21.6078080583642,22.5581376482118,22.2808419125336,22.0856083513349,21.8722363624017,20.8012939795849,20.4735620459899,20.2390543962493,19.7694706560131,19.6613635596585,19.1743648617399,18.7770247738477,18.6965128923369,17.85713260262,17.4884729346498,16.979666782304,16.879982944413,16.9602881201946,17.1019848975389,17.5450069515771,17.8864848161618,17.9135115902505,18.1049727718919,18.170498488038,18.3999935238462,18.5549711442895,18.8531441586136],"lat":[49.4962297633776,49.4358458522446,49.5715740016592,49.2171253525692,49.4314533554998,49.3287722845358,49.4701073268541,49.0857380234671,48.8253921575807,48.4222643092718,48.31997081155,48.6238540716424,48.5628500433218,48.3275672470969,48.2026911484636,48.2666148952087,48.1113788926039,48.0817682969006,47.8809536810144,47.7584288600504,47.8674661321862,48.1234970159763,48.4700133327095,48.5969823268506,48.8169688991171,48.8000190293254,48.9034752467737,48.9964928248991,49.0439834661753,49.2715147975564,49.31500051533,49.4950153672188,49.4962297633776]}]],[[{"lng":[13.8064754574215,14.6324715511748,15.137091912505,16.0116638526127,16.2022982113374,16.3705049984474,16.5648083838649,15.7687329444086,15.6715295752676,15.3239538916724,15.3276745947974,14.9352437679729,14.5951094906278,14.4119682145854,13.7150598486972,13.9376302425783,13.6981099789055,13.8064754574215],"lat":[46.5093061386912,46.4318173284695,46.658702704447,46.6836107448117,46.852385972677,46.8413272161665,46.5037509222198,46.2381082220234,45.8341535507979,45.7317825384277,45.4523163925932,45.4716950547027,45.6349409043127,45.4661656764475,45.5003237981924,45.5910159368646,46.0167780625174,46.5093061386912]}]],[[{"lng":[22.1831734555019,21.2135168799772,21.369631381931,19.7788757666902,17.8477791683752,17.1195548845181,17.8313460629064,18.7877217953321,17.8692248877763,16.8291850114701,16.4477095882915,15.8797855974038,14.6666813493521,14.1007210628915,12.9429105973921,12.625100538797,11.7879423356687,11.0273686051969,11.4682719255111,12.3003658382749,12.6311466813752,11.9920642432216,11.9305692887942,12.5799353369739,13.5719161312487,13.9199052263022,13.5556897315091,15.108411492583,16.1087121924568,16.7688786149855,17.7291817562653,17.9938684424643,19.8785596045813,20.0252689958579,20.6455928890895,21.9785347836261,23.5394730974344,23.5658797543356,23.9033785336338,22.1831734555019],"lat":[65.7237405463202,65.0260053575153,64.4135879584243,63.609554348395,62.7494001328968,61.341165676511,60.6365833604274,60.0819143744226,58.9537661810587,58.7198269720734,57.0411180690719,56.1043018662687,56.2008851182222,55.4077810736227,55.3617373724506,56.307080186582,57.4418171250631,58.8561494004594,59.432393296946,60.11793284773,61.2935716823701,61.8003624538566,63.128317572677,64.0662189805583,64.0491140814697,64.4454206407161,64.7870276963815,66.1938668890955,67.3024555528369,68.0139366726314,68.0105518663163,68.5673912624774,68.4071943223726,69.0651386583127,69.1062472602009,68.6168456081807,67.9360086127353,66.3960509304374,66.0069273952796,65.7237405463202]}]],[[{"lng":[31.7859981625716,32.1594120623127,32.4120581397876,32.715760532367,33.7526998227357,34.391730584457,34.1419783871904,34.2248157081543,35.0221830584179,35.3779236183151,35.3561161638879,36.6261678403253,37.3934595069951,38.0106311378569,38.5949882342134,40.0690584653391,40.0807890154693,39.6746639340875,39.8956323585676,39.7382776222388,38.7705847511412,38.2551123390298,38.2235380388994,37.42513715999,36.7598547706644,35.8236845232648,34.9623417498239,35.020787794746,35.5100085792532,36.5299979998302,36.3347127621992,35.2399992205281,33.8825110206529,33.32642093276,33.5469242693495,32.4541744321055,32.6308044776791,33.5881620623184,33.2985673357547,31.7441402524152,31.6753072446024,30.7487488136091,30.3776086768889,29.6032890154274,29.1497249692017,28.6797794939394,28.233553501099,28.4852694027928,28.6599874203716,28.9337174822216,28.8629724464141,29.0721069678993,29.1706539242799,29.7599719581364,30.0246586443354,29.8382100766263,29.9088517595693,29.5596741065731,29.4151351254527,29.0508679542273,29.122698195113,28.6708911475852,28.2595467465418,27.5225374691952,26.8578235206248,26.6193367855978,26.1974503923669,25.9459411964024,25.207743361113,24.8663171729606,24.4020561052504,23.7609582862374,23.1422363624068,22.7105314470405,22.6408199398788,22.0856083513349,22.2808419125336,22.5581376482118,22.7764188982126,22.5184501482116,23.4265084164444,23.9227571957433,24.0299857927489,23.5270707536844,24.0050777523842,24.5531063168395,25.327787713327,26.3379586117686,27.4540661964084,28.2416150245366,28.6176127458922,28.9928353207635,29.2549381853479,30.1573637224609,30.5551172218115,30.6194543800148,30.927549269339,31.7859981625716],"lat":[52.1016779648855,52.0612669948332,52.2886949733497,52.2384654811621,52.3350745713317,51.7688817409258,51.5664134792062,51.255993150429,51.2075723333715,50.7739553900104,50.5771973740591,50.2255909287451,50.3839533555036,49.9156615260746,49.9264619004236,49.6010554062817,49.3074299179993,48.7838184678019,48.2324050970314,47.898937079452,47.8256082220298,47.5464004583568,47.1021898463759,47.0222205674042,46.6987002630409,46.6459644638871,46.2731965195496,45.6512189804847,45.4099933945462,45.4699897324371,45.113215643894,44.9399962428516,44.3614785833441,44.5648770208449,45.0347708196749,45.3274661321761,45.5191856959789,45.8515685084802,46.0805984563978,46.3333478867374,46.7062450221555,46.583100084004,46.0324101832857,45.2933080104311,45.4649254420725,45.3040308701317,45.4882831894684,45.5969070501459,45.9399868841316,46.2588304713725,46.4378893092638,46.5176777207225,46.3792623968287,46.3499876979354,46.423936672545,46.5253258327017,46.6743606634315,46.9285828720913,47.3466452093326,47.5102269557525,47.8490951605065,48.1181485052341,48.1555622422134,48.4671194525011,48.3682107610945,48.2207262233335,48.2208812526303,47.9871487493742,47.8910564235275,47.7375257431883,47.9818777532804,47.9855984564055,48.0963410508069,47.8821939153894,48.1502395696874,48.4222643092718,48.8253921575807,49.0857380234671,49.0273953314096,49.4767735866197,50.3085057643575,50.4248810898788,50.7054066025752,51.5784540879302,51.6174439560945,51.8884610052492,51.9106560329186,51.8322887233479,51.5923033717845,51.5722270778391,51.4277139349348,51.6020443792715,51.3682343613669,51.4161384141015,51.3195034857157,51.8228060980224,52.0423534206144,52.1016779648855]}]]],null,"countries",{"crs":{"crsClass":"L.CRS.EPSG3857","code":null,"proj4def":null,"projectedBounds":null,"options":{}},"pane":"polygon","stroke":true,"color":"#333333","weight":1,"opacity":0.9,"fill":true,"fillColor":"#6666FF","fillOpacity":0.6,"smoothFactor":1,"noClip":false},["<html><head><link rel=\"stylesheet\" type=\"text/css\" href=\"lib/popup/popup.css\"><\/head><body><div class=\"scrollableContainer\"><table class=\"popup scrollable\" id=\"popup\"><tr class='coord'><td><\/td><td><b>Feature ID<\/b><\/td><td align='right'>1 <\/td><\/tr><tr class='alt'><td>1<\/td><td><b>name <\/b><\/td><td align='right'>Albania <\/td><\/tr><tr><td>2<\/td><td><b>pop_est <\/b><\/td><td align='right'>3639453 <\/td><\/tr><tr class='alt'><td>3<\/td><td><b>subregion <\/b><\/td><td align='right'>Southern Europe <\/td><\/tr><tr><td>4<\/td><td><b>pop.million <\/b><\/td><td align='right'>3.639453 <\/td><\/tr><tr class='alt'><td>5<\/td><td><b>geometry <\/b><\/td><td align='right'>sfc_MULTIPOLYGON <\/td><\/tr><\/table><\/div><\/body><\/html>","<html><head><link rel=\"stylesheet\" type=\"text/css\" href=\"lib/popup/popup.css\"><\/head><body><div class=\"scrollableContainer\"><table class=\"popup scrollable\" id=\"popup\"><tr class='coord'><td><\/td><td><b>Feature ID<\/b><\/td><td align='right'>2 <\/td><\/tr><tr class='alt'><td>1<\/td><td><b>name <\/b><\/td><td align='right'>Austria <\/td><\/tr><tr><td>2<\/td><td><b>pop_est <\/b><\/td><td align='right'>8210281 <\/td><\/tr><tr class='alt'><td>3<\/td><td><b>subregion <\/b><\/td><td align='right'>Western Europe <\/td><\/tr><tr><td>4<\/td><td><b>pop.million <\/b><\/td><td align='right'>8.210281 <\/td><\/tr><tr class='alt'><td>5<\/td><td><b>geometry <\/b><\/td><td align='right'>sfc_MULTIPOLYGON <\/td><\/tr><\/table><\/div><\/body><\/html>","<html><head><link rel=\"stylesheet\" type=\"text/css\" href=\"lib/popup/popup.css\"><\/head><body><div class=\"scrollableContainer\"><table class=\"popup scrollable\" id=\"popup\"><tr class='coord'><td><\/td><td><b>Feature ID<\/b><\/td><td align='right'>3 <\/td><\/tr><tr class='alt'><td>1<\/td><td><b>name <\/b><\/td><td align='right'>Belgium <\/td><\/tr><tr><td>2<\/td><td><b>pop_est <\/b><\/td><td align='right'>10414336 <\/td><\/tr><tr class='alt'><td>3<\/td><td><b>subregion <\/b><\/td><td align='right'>Western Europe <\/td><\/tr><tr><td>4<\/td><td><b>pop.million <\/b><\/td><td align='right'>10.414336 <\/td><\/tr><tr class='alt'><td>5<\/td><td><b>geometry <\/b><\/td><td align='right'>sfc_MULTIPOLYGON <\/td><\/tr><\/table><\/div><\/body><\/html>","<html><head><link rel=\"stylesheet\" type=\"text/css\" href=\"lib/popup/popup.css\"><\/head><body><div class=\"scrollableContainer\"><table class=\"popup scrollable\" id=\"popup\"><tr class='coord'><td><\/td><td><b>Feature ID<\/b><\/td><td align='right'>4 <\/td><\/tr><tr class='alt'><td>1<\/td><td><b>name <\/b><\/td><td align='right'>Bulgaria <\/td><\/tr><tr><td>2<\/td><td><b>pop_est <\/b><\/td><td align='right'>7204687 <\/td><\/tr><tr class='alt'><td>3<\/td><td><b>subregion <\/b><\/td><td align='right'>Eastern Europe <\/td><\/tr><tr><td>4<\/td><td><b>pop.million <\/b><\/td><td align='right'>7.204687 <\/td><\/tr><tr class='alt'><td>5<\/td><td><b>geometry <\/b><\/td><td align='right'>sfc_MULTIPOLYGON <\/td><\/tr><\/table><\/div><\/body><\/html>","<html><head><link rel=\"stylesheet\" type=\"text/css\" href=\"lib/popup/popup.css\"><\/head><body><div class=\"scrollableContainer\"><table class=\"popup scrollable\" id=\"popup\"><tr class='coord'><td><\/td><td><b>Feature ID<\/b><\/td><td align='right'>5 <\/td><\/tr><tr class='alt'><td>1<\/td><td><b>name <\/b><\/td><td align='right'>Bosnia and Herz. <\/td><\/tr><tr><td>2<\/td><td><b>pop_est <\/b><\/td><td align='right'>4613414 <\/td><\/tr><tr class='alt'><td>3<\/td><td><b>subregion <\/b><\/td><td align='right'>Southern Europe <\/td><\/tr><tr><td>4<\/td><td><b>pop.million <\/b><\/td><td align='right'>4.613414 <\/td><\/tr><tr class='alt'><td>5<\/td><td><b>geometry <\/b><\/td><td align='right'>sfc_MULTIPOLYGON <\/td><\/tr><\/table><\/div><\/body><\/html>","<html><head><link rel=\"stylesheet\" type=\"text/css\" href=\"lib/popup/popup.css\"><\/head><body><div class=\"scrollableContainer\"><table class=\"popup scrollable\" id=\"popup\"><tr class='coord'><td><\/td><td><b>Feature ID<\/b><\/td><td align='right'>6 <\/td><\/tr><tr class='alt'><td>1<\/td><td><b>name <\/b><\/td><td align='right'>Belarus <\/td><\/tr><tr><td>2<\/td><td><b>pop_est <\/b><\/td><td align='right'>9648533 <\/td><\/tr><tr class='alt'><td>3<\/td><td><b>subregion <\/b><\/td><td align='right'>Eastern Europe <\/td><\/tr><tr><td>4<\/td><td><b>pop.million <\/b><\/td><td align='right'>9.648533 <\/td><\/tr><tr class='alt'><td>5<\/td><td><b>geometry <\/b><\/td><td align='right'>sfc_MULTIPOLYGON <\/td><\/tr><\/table><\/div><\/body><\/html>","<html><head><link rel=\"stylesheet\" type=\"text/css\" href=\"lib/popup/popup.css\"><\/head><body><div class=\"scrollableContainer\"><table class=\"popup scrollable\" id=\"popup\"><tr class='coord'><td><\/td><td><b>Feature ID<\/b><\/td><td align='right'>7 <\/td><\/tr><tr class='alt'><td>1<\/td><td><b>name <\/b><\/td><td align='right'>Switzerland <\/td><\/tr><tr><td>2<\/td><td><b>pop_est <\/b><\/td><td align='right'>7604467 <\/td><\/tr><tr class='alt'><td>3<\/td><td><b>subregion <\/b><\/td><td align='right'>Western Europe <\/td><\/tr><tr><td>4<\/td><td><b>pop.million <\/b><\/td><td align='right'>7.604467 <\/td><\/tr><tr class='alt'><td>5<\/td><td><b>geometry <\/b><\/td><td align='right'>sfc_MULTIPOLYGON <\/td><\/tr><\/table><\/div><\/body><\/html>","<html><head><link rel=\"stylesheet\" type=\"text/css\" href=\"lib/popup/popup.css\"><\/head><body><div class=\"scrollableContainer\"><table class=\"popup scrollable\" id=\"popup\"><tr class='coord'><td><\/td><td><b>Feature ID<\/b><\/td><td align='right'>8 <\/td><\/tr><tr class='alt'><td>1<\/td><td><b>name <\/b><\/td><td align='right'>Czech Rep. <\/td><\/tr><tr><td>2<\/td><td><b>pop_est <\/b><\/td><td align='right'>10211904 <\/td><\/tr><tr class='alt'><td>3<\/td><td><b>subregion <\/b><\/td><td align='right'>Eastern Europe <\/td><\/tr><tr><td>4<\/td><td><b>pop.million <\/b><\/td><td align='right'>10.211904 <\/td><\/tr><tr class='alt'><td>5<\/td><td><b>geometry <\/b><\/td><td align='right'>sfc_MULTIPOLYGON <\/td><\/tr><\/table><\/div><\/body><\/html>","<html><head><link rel=\"stylesheet\" type=\"text/css\" href=\"lib/popup/popup.css\"><\/head><body><div class=\"scrollableContainer\"><table class=\"popup scrollable\" id=\"popup\"><tr class='coord'><td><\/td><td><b>Feature ID<\/b><\/td><td align='right'>9 <\/td><\/tr><tr class='alt'><td>1<\/td><td><b>name <\/b><\/td><td align='right'>Germany <\/td><\/tr><tr><td>2<\/td><td><b>pop_est <\/b><\/td><td align='right'>82329758 <\/td><\/tr><tr class='alt'><td>3<\/td><td><b>subregion <\/b><\/td><td align='right'>Western Europe <\/td><\/tr><tr><td>4<\/td><td><b>pop.million <\/b><\/td><td align='right'>82.329758 <\/td><\/tr><tr class='alt'><td>5<\/td><td><b>geometry <\/b><\/td><td align='right'>sfc_MULTIPOLYGON <\/td><\/tr><\/table><\/div><\/body><\/html>","<html><head><link rel=\"stylesheet\" type=\"text/css\" href=\"lib/popup/popup.css\"><\/head><body><div class=\"scrollableContainer\"><table class=\"popup scrollable\" id=\"popup\"><tr class='coord'><td><\/td><td><b>Feature ID<\/b><\/td><td align='right'>10 <\/td><\/tr><tr class='alt'><td>1<\/td><td><b>name <\/b><\/td><td align='right'>Denmark <\/td><\/tr><tr><td>2<\/td><td><b>pop_est <\/b><\/td><td align='right'>5500510 <\/td><\/tr><tr class='alt'><td>3<\/td><td><b>subregion <\/b><\/td><td align='right'>Northern Europe <\/td><\/tr><tr><td>4<\/td><td><b>pop.million <\/b><\/td><td align='right'>5.50051 <\/td><\/tr><tr class='alt'><td>5<\/td><td><b>geometry <\/b><\/td><td align='right'>sfc_MULTIPOLYGON <\/td><\/tr><\/table><\/div><\/body><\/html>","<html><head><link rel=\"stylesheet\" type=\"text/css\" href=\"lib/popup/popup.css\"><\/head><body><div class=\"scrollableContainer\"><table class=\"popup scrollable\" id=\"popup\"><tr class='coord'><td><\/td><td><b>Feature ID<\/b><\/td><td align='right'>11 <\/td><\/tr><tr class='alt'><td>1<\/td><td><b>name <\/b><\/td><td align='right'>Spain <\/td><\/tr><tr><td>2<\/td><td><b>pop_est <\/b><\/td><td align='right'>40525002 <\/td><\/tr><tr class='alt'><td>3<\/td><td><b>subregion <\/b><\/td><td align='right'>Southern Europe <\/td><\/tr><tr><td>4<\/td><td><b>pop.million <\/b><\/td><td align='right'>40.525002 <\/td><\/tr><tr class='alt'><td>5<\/td><td><b>geometry <\/b><\/td><td align='right'>sfc_MULTIPOLYGON <\/td><\/tr><\/table><\/div><\/body><\/html>","<html><head><link rel=\"stylesheet\" type=\"text/css\" href=\"lib/popup/popup.css\"><\/head><body><div class=\"scrollableContainer\"><table class=\"popup scrollable\" id=\"popup\"><tr class='coord'><td><\/td><td><b>Feature ID<\/b><\/td><td align='right'>12 <\/td><\/tr><tr class='alt'><td>1<\/td><td><b>name <\/b><\/td><td align='right'>Estonia <\/td><\/tr><tr><td>2<\/td><td><b>pop_est <\/b><\/td><td align='right'>1299371 <\/td><\/tr><tr class='alt'><td>3<\/td><td><b>subregion <\/b><\/td><td align='right'>Northern Europe <\/td><\/tr><tr><td>4<\/td><td><b>pop.million <\/b><\/td><td align='right'>1.299371 <\/td><\/tr><tr class='alt'><td>5<\/td><td><b>geometry <\/b><\/td><td align='right'>sfc_MULTIPOLYGON <\/td><\/tr><\/table><\/div><\/body><\/html>","<html><head><link rel=\"stylesheet\" type=\"text/css\" href=\"lib/popup/popup.css\"><\/head><body><div class=\"scrollableContainer\"><table class=\"popup scrollable\" id=\"popup\"><tr class='coord'><td><\/td><td><b>Feature ID<\/b><\/td><td align='right'>13 <\/td><\/tr><tr class='alt'><td>1<\/td><td><b>name <\/b><\/td><td align='right'>Finland <\/td><\/tr><tr><td>2<\/td><td><b>pop_est <\/b><\/td><td align='right'>5250275 <\/td><\/tr><tr class='alt'><td>3<\/td><td><b>subregion <\/b><\/td><td align='right'>Northern Europe <\/td><\/tr><tr><td>4<\/td><td><b>pop.million <\/b><\/td><td align='right'>5.250275 <\/td><\/tr><tr class='alt'><td>5<\/td><td><b>geometry <\/b><\/td><td align='right'>sfc_MULTIPOLYGON <\/td><\/tr><\/table><\/div><\/body><\/html>","<html><head><link rel=\"stylesheet\" type=\"text/css\" href=\"lib/popup/popup.css\"><\/head><body><div class=\"scrollableContainer\"><table class=\"popup scrollable\" id=\"popup\"><tr class='coord'><td><\/td><td><b>Feature ID<\/b><\/td><td align='right'>14 <\/td><\/tr><tr class='alt'><td>1<\/td><td><b>name <\/b><\/td><td align='right'>France <\/td><\/tr><tr><td>2<\/td><td><b>pop_est <\/b><\/td><td align='right'>64057792 <\/td><\/tr><tr class='alt'><td>3<\/td><td><b>subregion <\/b><\/td><td align='right'>Western Europe <\/td><\/tr><tr><td>4<\/td><td><b>pop.million <\/b><\/td><td align='right'>64.057792 <\/td><\/tr><tr class='alt'><td>5<\/td><td><b>geometry <\/b><\/td><td align='right'>sfc_MULTIPOLYGON <\/td><\/tr><\/table><\/div><\/body><\/html>","<html><head><link rel=\"stylesheet\" type=\"text/css\" href=\"lib/popup/popup.css\"><\/head><body><div class=\"scrollableContainer\"><table class=\"popup scrollable\" id=\"popup\"><tr class='coord'><td><\/td><td><b>Feature ID<\/b><\/td><td align='right'>15 <\/td><\/tr><tr class='alt'><td>1<\/td><td><b>name <\/b><\/td><td align='right'>United Kingdom <\/td><\/tr><tr><td>2<\/td><td><b>pop_est <\/b><\/td><td align='right'>62262000 <\/td><\/tr><tr class='alt'><td>3<\/td><td><b>subregion <\/b><\/td><td align='right'>Northern Europe <\/td><\/tr><tr><td>4<\/td><td><b>pop.million <\/b><\/td><td align='right'>62.262 <\/td><\/tr><tr class='alt'><td>5<\/td><td><b>geometry <\/b><\/td><td align='right'>sfc_MULTIPOLYGON <\/td><\/tr><\/table><\/div><\/body><\/html>","<html><head><link rel=\"stylesheet\" type=\"text/css\" href=\"lib/popup/popup.css\"><\/head><body><div class=\"scrollableContainer\"><table class=\"popup scrollable\" id=\"popup\"><tr class='coord'><td><\/td><td><b>Feature ID<\/b><\/td><td align='right'>16 <\/td><\/tr><tr class='alt'><td>1<\/td><td><b>name <\/b><\/td><td align='right'>Greece <\/td><\/tr><tr><td>2<\/td><td><b>pop_est <\/b><\/td><td align='right'>10737428 <\/td><\/tr><tr class='alt'><td>3<\/td><td><b>subregion <\/b><\/td><td align='right'>Southern Europe <\/td><\/tr><tr><td>4<\/td><td><b>pop.million <\/b><\/td><td align='right'>10.737428 <\/td><\/tr><tr class='alt'><td>5<\/td><td><b>geometry <\/b><\/td><td align='right'>sfc_MULTIPOLYGON <\/td><\/tr><\/table><\/div><\/body><\/html>","<html><head><link rel=\"stylesheet\" type=\"text/css\" href=\"lib/popup/popup.css\"><\/head><body><div class=\"scrollableContainer\"><table class=\"popup scrollable\" id=\"popup\"><tr class='coord'><td><\/td><td><b>Feature ID<\/b><\/td><td align='right'>17 <\/td><\/tr><tr class='alt'><td>1<\/td><td><b>name <\/b><\/td><td align='right'>Croatia <\/td><\/tr><tr><td>2<\/td><td><b>pop_est <\/b><\/td><td align='right'>4489409 <\/td><\/tr><tr class='alt'><td>3<\/td><td><b>subregion <\/b><\/td><td align='right'>Southern Europe <\/td><\/tr><tr><td>4<\/td><td><b>pop.million <\/b><\/td><td align='right'>4.489409 <\/td><\/tr><tr class='alt'><td>5<\/td><td><b>geometry <\/b><\/td><td align='right'>sfc_MULTIPOLYGON <\/td><\/tr><\/table><\/div><\/body><\/html>","<html><head><link rel=\"stylesheet\" type=\"text/css\" href=\"lib/popup/popup.css\"><\/head><body><div class=\"scrollableContainer\"><table class=\"popup scrollable\" id=\"popup\"><tr class='coord'><td><\/td><td><b>Feature ID<\/b><\/td><td align='right'>18 <\/td><\/tr><tr class='alt'><td>1<\/td><td><b>name <\/b><\/td><td align='right'>Hungary <\/td><\/tr><tr><td>2<\/td><td><b>pop_est <\/b><\/td><td align='right'>9905596 <\/td><\/tr><tr class='alt'><td>3<\/td><td><b>subregion <\/b><\/td><td align='right'>Eastern Europe <\/td><\/tr><tr><td>4<\/td><td><b>pop.million <\/b><\/td><td align='right'>9.905596 <\/td><\/tr><tr class='alt'><td>5<\/td><td><b>geometry <\/b><\/td><td align='right'>sfc_MULTIPOLYGON <\/td><\/tr><\/table><\/div><\/body><\/html>","<html><head><link rel=\"stylesheet\" type=\"text/css\" href=\"lib/popup/popup.css\"><\/head><body><div class=\"scrollableContainer\"><table class=\"popup scrollable\" id=\"popup\"><tr class='coord'><td><\/td><td><b>Feature ID<\/b><\/td><td align='right'>19 <\/td><\/tr><tr class='alt'><td>1<\/td><td><b>name <\/b><\/td><td align='right'>Ireland <\/td><\/tr><tr><td>2<\/td><td><b>pop_est <\/b><\/td><td align='right'>4203200 <\/td><\/tr><tr class='alt'><td>3<\/td><td><b>subregion <\/b><\/td><td align='right'>Northern Europe <\/td><\/tr><tr><td>4<\/td><td><b>pop.million <\/b><\/td><td align='right'>4.2032 <\/td><\/tr><tr class='alt'><td>5<\/td><td><b>geometry <\/b><\/td><td align='right'>sfc_MULTIPOLYGON <\/td><\/tr><\/table><\/div><\/body><\/html>","<html><head><link rel=\"stylesheet\" type=\"text/css\" href=\"lib/popup/popup.css\"><\/head><body><div class=\"scrollableContainer\"><table class=\"popup scrollable\" id=\"popup\"><tr class='coord'><td><\/td><td><b>Feature ID<\/b><\/td><td align='right'>20 <\/td><\/tr><tr class='alt'><td>1<\/td><td><b>name <\/b><\/td><td align='right'>Iceland <\/td><\/tr><tr><td>2<\/td><td><b>pop_est <\/b><\/td><td align='right'>306694 <\/td><\/tr><tr class='alt'><td>3<\/td><td><b>subregion <\/b><\/td><td align='right'>Northern Europe <\/td><\/tr><tr><td>4<\/td><td><b>pop.million <\/b><\/td><td align='right'>0.306694 <\/td><\/tr><tr class='alt'><td>5<\/td><td><b>geometry <\/b><\/td><td align='right'>sfc_MULTIPOLYGON <\/td><\/tr><\/table><\/div><\/body><\/html>","<html><head><link rel=\"stylesheet\" type=\"text/css\" href=\"lib/popup/popup.css\"><\/head><body><div class=\"scrollableContainer\"><table class=\"popup scrollable\" id=\"popup\"><tr class='coord'><td><\/td><td><b>Feature ID<\/b><\/td><td align='right'>21 <\/td><\/tr><tr class='alt'><td>1<\/td><td><b>name <\/b><\/td><td align='right'>Italy <\/td><\/tr><tr><td>2<\/td><td><b>pop_est <\/b><\/td><td align='right'>58126212 <\/td><\/tr><tr class='alt'><td>3<\/td><td><b>subregion <\/b><\/td><td align='right'>Southern Europe <\/td><\/tr><tr><td>4<\/td><td><b>pop.million <\/b><\/td><td align='right'>58.126212 <\/td><\/tr><tr class='alt'><td>5<\/td><td><b>geometry <\/b><\/td><td align='right'>sfc_MULTIPOLYGON <\/td><\/tr><\/table><\/div><\/body><\/html>","<html><head><link rel=\"stylesheet\" type=\"text/css\" href=\"lib/popup/popup.css\"><\/head><body><div class=\"scrollableContainer\"><table class=\"popup scrollable\" id=\"popup\"><tr class='coord'><td><\/td><td><b>Feature ID<\/b><\/td><td align='right'>22 <\/td><\/tr><tr class='alt'><td>1<\/td><td><b>name <\/b><\/td><td align='right'>Kosovo <\/td><\/tr><tr><td>2<\/td><td><b>pop_est <\/b><\/td><td align='right'>1804838 <\/td><\/tr><tr class='alt'><td>3<\/td><td><b>subregion <\/b><\/td><td align='right'>Southern Europe <\/td><\/tr><tr><td>4<\/td><td><b>pop.million <\/b><\/td><td align='right'>1.804838 <\/td><\/tr><tr class='alt'><td>5<\/td><td><b>geometry <\/b><\/td><td align='right'>sfc_MULTIPOLYGON <\/td><\/tr><\/table><\/div><\/body><\/html>","<html><head><link rel=\"stylesheet\" type=\"text/css\" href=\"lib/popup/popup.css\"><\/head><body><div class=\"scrollableContainer\"><table class=\"popup scrollable\" id=\"popup\"><tr class='coord'><td><\/td><td><b>Feature ID<\/b><\/td><td align='right'>23 <\/td><\/tr><tr class='alt'><td>1<\/td><td><b>name <\/b><\/td><td align='right'>Lithuania <\/td><\/tr><tr><td>2<\/td><td><b>pop_est <\/b><\/td><td align='right'>3555179 <\/td><\/tr><tr class='alt'><td>3<\/td><td><b>subregion <\/b><\/td><td align='right'>Northern Europe <\/td><\/tr><tr><td>4<\/td><td><b>pop.million <\/b><\/td><td align='right'>3.555179 <\/td><\/tr><tr class='alt'><td>5<\/td><td><b>geometry <\/b><\/td><td align='right'>sfc_MULTIPOLYGON <\/td><\/tr><\/table><\/div><\/body><\/html>","<html><head><link rel=\"stylesheet\" type=\"text/css\" href=\"lib/popup/popup.css\"><\/head><body><div class=\"scrollableContainer\"><table class=\"popup scrollable\" id=\"popup\"><tr class='coord'><td><\/td><td><b>Feature ID<\/b><\/td><td align='right'>24 <\/td><\/tr><tr class='alt'><td>1<\/td><td><b>name <\/b><\/td><td align='right'>Luxembourg <\/td><\/tr><tr><td>2<\/td><td><b>pop_est <\/b><\/td><td align='right'>491775 <\/td><\/tr><tr class='alt'><td>3<\/td><td><b>subregion <\/b><\/td><td align='right'>Western Europe <\/td><\/tr><tr><td>4<\/td><td><b>pop.million <\/b><\/td><td align='right'>0.491775 <\/td><\/tr><tr class='alt'><td>5<\/td><td><b>geometry <\/b><\/td><td align='right'>sfc_MULTIPOLYGON <\/td><\/tr><\/table><\/div><\/body><\/html>","<html><head><link rel=\"stylesheet\" type=\"text/css\" href=\"lib/popup/popup.css\"><\/head><body><div class=\"scrollableContainer\"><table class=\"popup scrollable\" id=\"popup\"><tr class='coord'><td><\/td><td><b>Feature ID<\/b><\/td><td align='right'>25 <\/td><\/tr><tr class='alt'><td>1<\/td><td><b>name <\/b><\/td><td align='right'>Latvia <\/td><\/tr><tr><td>2<\/td><td><b>pop_est <\/b><\/td><td align='right'>2231503 <\/td><\/tr><tr class='alt'><td>3<\/td><td><b>subregion <\/b><\/td><td align='right'>Northern Europe <\/td><\/tr><tr><td>4<\/td><td><b>pop.million <\/b><\/td><td align='right'>2.231503 <\/td><\/tr><tr class='alt'><td>5<\/td><td><b>geometry <\/b><\/td><td align='right'>sfc_MULTIPOLYGON <\/td><\/tr><\/table><\/div><\/body><\/html>","<html><head><link rel=\"stylesheet\" type=\"text/css\" href=\"lib/popup/popup.css\"><\/head><body><div class=\"scrollableContainer\"><table class=\"popup scrollable\" id=\"popup\"><tr class='coord'><td><\/td><td><b>Feature ID<\/b><\/td><td align='right'>26 <\/td><\/tr><tr class='alt'><td>1<\/td><td><b>name <\/b><\/td><td align='right'>Moldova <\/td><\/tr><tr><td>2<\/td><td><b>pop_est <\/b><\/td><td align='right'>4320748 <\/td><\/tr><tr class='alt'><td>3<\/td><td><b>subregion <\/b><\/td><td align='right'>Eastern Europe <\/td><\/tr><tr><td>4<\/td><td><b>pop.million <\/b><\/td><td align='right'>4.320748 <\/td><\/tr><tr class='alt'><td>5<\/td><td><b>geometry <\/b><\/td><td align='right'>sfc_MULTIPOLYGON <\/td><\/tr><\/table><\/div><\/body><\/html>","<html><head><link rel=\"stylesheet\" type=\"text/css\" href=\"lib/popup/popup.css\"><\/head><body><div class=\"scrollableContainer\"><table class=\"popup scrollable\" id=\"popup\"><tr class='coord'><td><\/td><td><b>Feature ID<\/b><\/td><td align='right'>27 <\/td><\/tr><tr class='alt'><td>1<\/td><td><b>name <\/b><\/td><td align='right'>Macedonia <\/td><\/tr><tr><td>2<\/td><td><b>pop_est <\/b><\/td><td align='right'>2066718 <\/td><\/tr><tr class='alt'><td>3<\/td><td><b>subregion <\/b><\/td><td align='right'>Southern Europe <\/td><\/tr><tr><td>4<\/td><td><b>pop.million <\/b><\/td><td align='right'>2.066718 <\/td><\/tr><tr class='alt'><td>5<\/td><td><b>geometry <\/b><\/td><td align='right'>sfc_MULTIPOLYGON <\/td><\/tr><\/table><\/div><\/body><\/html>","<html><head><link rel=\"stylesheet\" type=\"text/css\" href=\"lib/popup/popup.css\"><\/head><body><div class=\"scrollableContainer\"><table class=\"popup scrollable\" id=\"popup\"><tr class='coord'><td><\/td><td><b>Feature ID<\/b><\/td><td align='right'>28 <\/td><\/tr><tr class='alt'><td>1<\/td><td><b>name <\/b><\/td><td align='right'>Montenegro <\/td><\/tr><tr><td>2<\/td><td><b>pop_est <\/b><\/td><td align='right'>672180 <\/td><\/tr><tr class='alt'><td>3<\/td><td><b>subregion <\/b><\/td><td align='right'>Southern Europe <\/td><\/tr><tr><td>4<\/td><td><b>pop.million <\/b><\/td><td align='right'>0.67218 <\/td><\/tr><tr class='alt'><td>5<\/td><td><b>geometry <\/b><\/td><td align='right'>sfc_MULTIPOLYGON <\/td><\/tr><\/table><\/div><\/body><\/html>","<html><head><link rel=\"stylesheet\" type=\"text/css\" href=\"lib/popup/popup.css\"><\/head><body><div class=\"scrollableContainer\"><table class=\"popup scrollable\" id=\"popup\"><tr class='coord'><td><\/td><td><b>Feature ID<\/b><\/td><td align='right'>29 <\/td><\/tr><tr class='alt'><td>1<\/td><td><b>name <\/b><\/td><td align='right'>Netherlands <\/td><\/tr><tr><td>2<\/td><td><b>pop_est <\/b><\/td><td align='right'>16715999 <\/td><\/tr><tr class='alt'><td>3<\/td><td><b>subregion <\/b><\/td><td align='right'>Western Europe <\/td><\/tr><tr><td>4<\/td><td><b>pop.million <\/b><\/td><td align='right'>16.715999 <\/td><\/tr><tr class='alt'><td>5<\/td><td><b>geometry <\/b><\/td><td align='right'>sfc_MULTIPOLYGON <\/td><\/tr><\/table><\/div><\/body><\/html>","<html><head><link rel=\"stylesheet\" type=\"text/css\" href=\"lib/popup/popup.css\"><\/head><body><div class=\"scrollableContainer\"><table class=\"popup scrollable\" id=\"popup\"><tr class='coord'><td><\/td><td><b>Feature ID<\/b><\/td><td align='right'>30 <\/td><\/tr><tr class='alt'><td>1<\/td><td><b>name <\/b><\/td><td align='right'>Norway <\/td><\/tr><tr><td>2<\/td><td><b>pop_est <\/b><\/td><td align='right'>4676305 <\/td><\/tr><tr class='alt'><td>3<\/td><td><b>subregion <\/b><\/td><td align='right'>Northern Europe <\/td><\/tr><tr><td>4<\/td><td><b>pop.million <\/b><\/td><td align='right'>4.676305 <\/td><\/tr><tr class='alt'><td>5<\/td><td><b>geometry <\/b><\/td><td align='right'>sfc_MULTIPOLYGON <\/td><\/tr><\/table><\/div><\/body><\/html>","<html><head><link rel=\"stylesheet\" type=\"text/css\" href=\"lib/popup/popup.css\"><\/head><body><div class=\"scrollableContainer\"><table class=\"popup scrollable\" id=\"popup\"><tr class='coord'><td><\/td><td><b>Feature ID<\/b><\/td><td align='right'>31 <\/td><\/tr><tr class='alt'><td>1<\/td><td><b>name <\/b><\/td><td align='right'>Poland <\/td><\/tr><tr><td>2<\/td><td><b>pop_est <\/b><\/td><td align='right'>38482919 <\/td><\/tr><tr class='alt'><td>3<\/td><td><b>subregion <\/b><\/td><td align='right'>Eastern Europe <\/td><\/tr><tr><td>4<\/td><td><b>pop.million <\/b><\/td><td align='right'>38.482919 <\/td><\/tr><tr class='alt'><td>5<\/td><td><b>geometry <\/b><\/td><td align='right'>sfc_MULTIPOLYGON <\/td><\/tr><\/table><\/div><\/body><\/html>","<html><head><link rel=\"stylesheet\" type=\"text/css\" href=\"lib/popup/popup.css\"><\/head><body><div class=\"scrollableContainer\"><table class=\"popup scrollable\" id=\"popup\"><tr class='coord'><td><\/td><td><b>Feature ID<\/b><\/td><td align='right'>32 <\/td><\/tr><tr class='alt'><td>1<\/td><td><b>name <\/b><\/td><td align='right'>Portugal <\/td><\/tr><tr><td>2<\/td><td><b>pop_est <\/b><\/td><td align='right'>10707924 <\/td><\/tr><tr class='alt'><td>3<\/td><td><b>subregion <\/b><\/td><td align='right'>Southern Europe <\/td><\/tr><tr><td>4<\/td><td><b>pop.million <\/b><\/td><td align='right'>10.707924 <\/td><\/tr><tr class='alt'><td>5<\/td><td><b>geometry <\/b><\/td><td align='right'>sfc_MULTIPOLYGON <\/td><\/tr><\/table><\/div><\/body><\/html>","<html><head><link rel=\"stylesheet\" type=\"text/css\" href=\"lib/popup/popup.css\"><\/head><body><div class=\"scrollableContainer\"><table class=\"popup scrollable\" id=\"popup\"><tr class='coord'><td><\/td><td><b>Feature ID<\/b><\/td><td align='right'>33 <\/td><\/tr><tr class='alt'><td>1<\/td><td><b>name <\/b><\/td><td align='right'>Romania <\/td><\/tr><tr><td>2<\/td><td><b>pop_est <\/b><\/td><td align='right'>22215421 <\/td><\/tr><tr class='alt'><td>3<\/td><td><b>subregion <\/b><\/td><td align='right'>Eastern Europe <\/td><\/tr><tr><td>4<\/td><td><b>pop.million <\/b><\/td><td align='right'>22.215421 <\/td><\/tr><tr class='alt'><td>5<\/td><td><b>geometry <\/b><\/td><td align='right'>sfc_MULTIPOLYGON <\/td><\/tr><\/table><\/div><\/body><\/html>","<html><head><link rel=\"stylesheet\" type=\"text/css\" href=\"lib/popup/popup.css\"><\/head><body><div class=\"scrollableContainer\"><table class=\"popup scrollable\" id=\"popup\"><tr class='coord'><td><\/td><td><b>Feature ID<\/b><\/td><td align='right'>34 <\/td><\/tr><tr class='alt'><td>1<\/td><td><b>name <\/b><\/td><td align='right'>Serbia <\/td><\/tr><tr><td>2<\/td><td><b>pop_est <\/b><\/td><td align='right'>7379339 <\/td><\/tr><tr class='alt'><td>3<\/td><td><b>subregion <\/b><\/td><td align='right'>Southern Europe <\/td><\/tr><tr><td>4<\/td><td><b>pop.million <\/b><\/td><td align='right'>7.379339 <\/td><\/tr><tr class='alt'><td>5<\/td><td><b>geometry <\/b><\/td><td align='right'>sfc_MULTIPOLYGON <\/td><\/tr><\/table><\/div><\/body><\/html>","<html><head><link rel=\"stylesheet\" type=\"text/css\" href=\"lib/popup/popup.css\"><\/head><body><div class=\"scrollableContainer\"><table class=\"popup scrollable\" id=\"popup\"><tr class='coord'><td><\/td><td><b>Feature ID<\/b><\/td><td align='right'>35 <\/td><\/tr><tr class='alt'><td>1<\/td><td><b>name <\/b><\/td><td align='right'>Slovakia <\/td><\/tr><tr><td>2<\/td><td><b>pop_est <\/b><\/td><td align='right'>5463046 <\/td><\/tr><tr class='alt'><td>3<\/td><td><b>subregion <\/b><\/td><td align='right'>Eastern Europe <\/td><\/tr><tr><td>4<\/td><td><b>pop.million <\/b><\/td><td align='right'>5.463046 <\/td><\/tr><tr class='alt'><td>5<\/td><td><b>geometry <\/b><\/td><td align='right'>sfc_MULTIPOLYGON <\/td><\/tr><\/table><\/div><\/body><\/html>","<html><head><link rel=\"stylesheet\" type=\"text/css\" href=\"lib/popup/popup.css\"><\/head><body><div class=\"scrollableContainer\"><table class=\"popup scrollable\" id=\"popup\"><tr class='coord'><td><\/td><td><b>Feature ID<\/b><\/td><td align='right'>36 <\/td><\/tr><tr class='alt'><td>1<\/td><td><b>name <\/b><\/td><td align='right'>Slovenia <\/td><\/tr><tr><td>2<\/td><td><b>pop_est <\/b><\/td><td align='right'>2005692 <\/td><\/tr><tr class='alt'><td>3<\/td><td><b>subregion <\/b><\/td><td align='right'>Southern Europe <\/td><\/tr><tr><td>4<\/td><td><b>pop.million <\/b><\/td><td align='right'>2.005692 <\/td><\/tr><tr class='alt'><td>5<\/td><td><b>geometry <\/b><\/td><td align='right'>sfc_MULTIPOLYGON <\/td><\/tr><\/table><\/div><\/body><\/html>","<html><head><link rel=\"stylesheet\" type=\"text/css\" href=\"lib/popup/popup.css\"><\/head><body><div class=\"scrollableContainer\"><table class=\"popup scrollable\" id=\"popup\"><tr class='coord'><td><\/td><td><b>Feature ID<\/b><\/td><td align='right'>37 <\/td><\/tr><tr class='alt'><td>1<\/td><td><b>name <\/b><\/td><td align='right'>Sweden <\/td><\/tr><tr><td>2<\/td><td><b>pop_est <\/b><\/td><td align='right'>9059651 <\/td><\/tr><tr class='alt'><td>3<\/td><td><b>subregion <\/b><\/td><td align='right'>Northern Europe <\/td><\/tr><tr><td>4<\/td><td><b>pop.million <\/b><\/td><td align='right'>9.059651 <\/td><\/tr><tr class='alt'><td>5<\/td><td><b>geometry <\/b><\/td><td align='right'>sfc_MULTIPOLYGON <\/td><\/tr><\/table><\/div><\/body><\/html>","<html><head><link rel=\"stylesheet\" type=\"text/css\" href=\"lib/popup/popup.css\"><\/head><body><div class=\"scrollableContainer\"><table class=\"popup scrollable\" id=\"popup\"><tr class='coord'><td><\/td><td><b>Feature ID<\/b><\/td><td align='right'>38 <\/td><\/tr><tr class='alt'><td>1<\/td><td><b>name <\/b><\/td><td align='right'>Ukraine <\/td><\/tr><tr><td>2<\/td><td><b>pop_est <\/b><\/td><td align='right'>45700395 <\/td><\/tr><tr class='alt'><td>3<\/td><td><b>subregion <\/b><\/td><td align='right'>Eastern Europe <\/td><\/tr><tr><td>4<\/td><td><b>pop.million <\/b><\/td><td align='right'>45.700395 <\/td><\/tr><tr class='alt'><td>5<\/td><td><b>geometry <\/b><\/td><td align='right'>sfc_MULTIPOLYGON <\/td><\/tr><\/table><\/div><\/body><\/html>"],{"maxWidth":800,"minWidth":50,"autoPan":true,"keepInView":false,"closeButton":true,"closeOnClick":true,"className":""},["1","2","3","4","5","6","7","8","9","10","11","12","13","14","15","16","17","18","19","20","21","22","23","24","25","26","27","28","29","30","31","32","33","34","35","36","37","38"],{"interactive":false,"permanent":false,"direction":"auto","opacity":1,"offset":[0,0],"textsize":"10px","textOnly":false,"className":"","sticky":true},{"stroke":true,"weight":2,"opacity":0.9,"fillOpacity":0.84,"bringToFront":false,"sendToBack":false}]},{"method":"addScaleBar","args":[{"maxWidth":100,"metric":true,"imperial":true,"updateWhenIdle":true,"position":"bottomleft"}]},{"method":"addHomeButton","args":[-24.3261840479393,34.9199876978896,40.0807890154693,80.6571442735935,"Zoom to countries","<strong> countries <\/strong>","bottomright"]},{"method":"addLayersControl","args":[["CartoDB.Positron","CartoDB.DarkMatter","OpenStreetMap","Esri.WorldImagery","OpenTopoMap"],"countries",{"collapsed":true,"autoZIndex":true,"position":"topleft"}]},{"method":"addLegend","args":[{"colors":["#6666FF"],"labels":["countries"],"na_color":null,"na_label":"NA","opacity":1,"position":"topright","type":"factor","title":"countries","extra":null,"layerId":null,"className":"info legend","group":"countries"}]}],"limits":{"lat":[34.9199876978896,80.6571442735935],"lng":[-24.3261840479393,40.0807890154693]}},"evals":[],"jsHooks":{"render":[{"code":"function(el, x, data) {\n return (\n function(el, x, data) {\n // get the leaflet map\n var map = this; //HTMLWidgets.find('#' + el.id);\n // we need a new div element because we have to handle\n // the mouseover output separately\n // debugger;\n function addElement () {\n // generate new div Element\n var newDiv = $(document.createElement('div'));\n // append at end of leaflet htmlwidget container\n $(el).append(newDiv);\n //provide ID and style\n newDiv.addClass('lnlt');\n newDiv.css({\n 'position': 'relative',\n 'bottomleft': '0px',\n 'background-color': 'rgba(255, 255, 255, 0.7)',\n 'box-shadow': '0 0 2px #bbb',\n 'background-clip': 'padding-box',\n 'margin': '0',\n 'padding-left': '5px',\n 'color': '#333',\n 'font': '9px/1.5 \"Helvetica Neue\", Arial, Helvetica, sans-serif',\n 'z-index': '700',\n });\n return newDiv;\n }\n\n\n // check for already existing lnlt class to not duplicate\n var lnlt = $(el).find('.lnlt');\n\n if(!lnlt.length) {\n lnlt = addElement();\n\n // grab the special div we generated in the beginning\n // and put the mousmove output there\n\n map.on('mousemove', function (e) {\n if (e.originalEvent.ctrlKey) {\n if (document.querySelector('.lnlt') === null) lnlt = addElement();\n lnlt.text(\n ' lon: ' + (e.latlng.lng).toFixed(5) +\n ' | lat: ' + (e.latlng.lat).toFixed(5) +\n ' | zoom: ' + map.getZoom() +\n ' | x: ' + L.CRS.EPSG3857.project(e.latlng).x.toFixed(0) +\n ' | y: ' + L.CRS.EPSG3857.project(e.latlng).y.toFixed(0) +\n ' | epsg: 3857 ' +\n ' | proj4: +proj=merc +a=6378137 +b=6378137 +lat_ts=0.0 +lon_0=0.0 +x_0=0.0 +y_0=0 +k=1.0 +units=m +nadgrids=@null +no_defs ');\n } else {\n if (document.querySelector('.lnlt') === null) lnlt = addElement();\n lnlt.text(\n ' lon: ' + (e.latlng.lng).toFixed(5) +\n ' | lat: ' + (e.latlng.lat).toFixed(5) +\n ' | zoom: ' + map.getZoom() + ' ');\n }\n });\n\n // remove the lnlt div when mouse leaves map\n map.on('mouseout', function (e) {\n var strip = document.querySelector('.lnlt');\n strip.remove();\n });\n\n };\n\n //$(el).keypress(67, function(e) {\n map.on('preclick', function(e) {\n if (e.originalEvent.ctrlKey) {\n if (document.querySelector('.lnlt') === null) lnlt = addElement();\n lnlt.text(\n ' lon: ' + (e.latlng.lng).toFixed(5) +\n ' | lat: ' + (e.latlng.lat).toFixed(5) +\n ' | zoom: ' + map.getZoom() + ' ');\n var txt = document.querySelector('.lnlt').textContent;\n console.log(txt);\n //txt.innerText.focus();\n //txt.select();\n setClipboardText('\"' + txt + '\"');\n }\n });\n\n //map.on('click', function (e) {\n // var txt = document.querySelector('.lnlt').textContent;\n // console.log(txt);\n // //txt.innerText.focus();\n // //txt.select();\n // setClipboardText(txt);\n //});\n\n function setClipboardText(text){\n var id = 'mycustom-clipboard-textarea-hidden-id';\n var existsTextarea = document.getElementById(id);\n\n if(!existsTextarea){\n console.log('Creating textarea');\n var textarea = document.createElement('textarea');\n textarea.id = id;\n // Place in top-left corner of screen regardless of scroll position.\n textarea.style.position = 'fixed';\n textarea.style.top = 0;\n textarea.style.left = 0;\n\n // Ensure it has a small width and height. Setting to 1px / 1em\n // doesn't work as this gives a negative w/h on some browsers.\n textarea.style.width = '1px';\n textarea.style.height = '1px';\n\n // We don't need padding, reducing the size if it does flash render.\n textarea.style.padding = 0;\n\n // Clean up any borders.\n textarea.style.border = 'none';\n textarea.style.outline = 'none';\n textarea.style.boxShadow = 'none';\n\n // Avoid flash of white box if rendered for any reason.\n textarea.style.background = 'transparent';\n document.querySelector('body').appendChild(textarea);\n console.log('The textarea now exists :)');\n existsTextarea = document.getElementById(id);\n }else{\n console.log('The textarea already exists :3')\n }\n\n existsTextarea.value = text;\n existsTextarea.select();\n\n try {\n var status = document.execCommand('copy');\n if(!status){\n console.error('Cannot copy text');\n }else{\n console.log('The text is now on the clipboard');\n }\n } catch (err) {\n console.log('Unable to copy.');\n }\n }\n\n\n }\n ).call(this.getMap(), el, x, data);\n}","data":null}]}}</script> --- ## Plotting sf objects with ggplot2 ```r ggplot() + geom_sf(data = countries, aes(fill = subregion)) ``` <!-- --> --- ## Plotting sf objects with ggplot2 ```r ggplot() + geom_sf(data = countries, aes(fill = name)) + theme(legend.position = "none") ``` <!-- --> --- ## Plotting sf objects with ggplot2 ```r ggplot() + geom_sf(data = countries, aes(fill = pop.million)) ``` 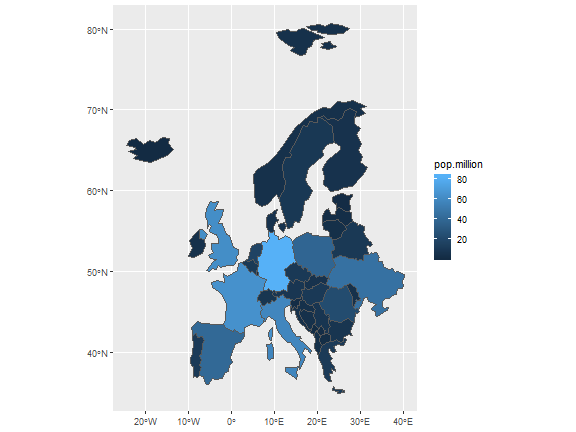<!-- --> --- ## Plotting with tmap ```r library(tmap) tm_shape(countries) + tm_fill(col = "subregion") + tm_layout(legend.position = c("left", "top")) ``` 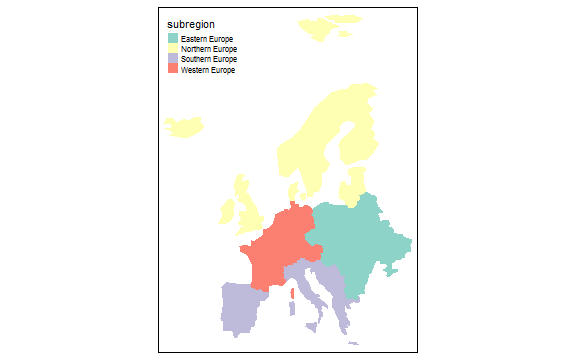<!-- --> --- class: inverse, middle, center # How to create sf from an R object? --- ## Making a data frame *spatial* ```r mydf <- read.csv("data/occs.csv") head(mydf) ``` ``` ## species x y ## 1 Solanum acaule Bitter -66.10 -21.90 ## 2 Solanum acaule Bitter -71.00 -13.50 ## 3 Solanum acaule Bitter -66.43 -24.22 ## 4 Solanum acaule Bitter -72.07 -13.35 ## 5 Solanum acaule Bitter -68.97 -15.23 ## 6 Solanum acaule Bitter -64.95 -17.75 ``` --- ## Making a data frame *spatial* ```r occs <- st_as_sf(mydf, coords = c("x", "y")) head(occs) ``` ``` ## Simple feature collection with 6 features and 1 field ## geometry type: POINT ## dimension: XY ## bbox: xmin: -72.07 ymin: -24.22 xmax: -64.95 ymax: -13.35 ## epsg (SRID): NA ## proj4string: NA ## species geometry ## 1 Solanum acaule Bitter POINT (-66.1 -21.9) ## 2 Solanum acaule Bitter POINT (-71 -13.5) ## 3 Solanum acaule Bitter POINT (-66.43 -24.22) ## 4 Solanum acaule Bitter POINT (-72.07 -13.35) ## 5 Solanum acaule Bitter POINT (-68.97 -15.23) ## 6 Solanum acaule Bitter POINT (-64.95 -17.75) ``` --- ## Setting the projection (Coordinate Reference System) ```r st_crs(occs) <- "+proj=longlat +ellps=WGS84 +datum=WGS84" ``` See http://spatialreference.org --- ## Changing projection ```r occs.laea <- st_transform(occs, crs = 3035) occs.laea ``` ``` ## Simple feature collection with 49 features and 1 field ## geometry type: POINT ## dimension: XY ## bbox: xmin: -4831320 ymin: -1011814 xmax: -4354226 ymax: 1006172 ## epsg (SRID): 3035 ## proj4string: +proj=laea +lat_0=52 +lon_0=10 +x_0=4321000 +y_0=3210000 +ellps=GRS80 +towgs84=0,0,0,0,0,0,0 +units=m +no_defs ## First 10 features: ## species geometry ## 1 Solanum acaule Bitter POINT (-4514047 -755397.4) ## 2 Solanum acaule Bitter POINT (-4750733 726537.4) ## 3 Solanum acaule Bitter POINT (-4560712 -998976) ## 4 Solanum acaule Bitter POINT (-4827141 862365.9) ## 5 Solanum acaule Bitter POINT (-4639318 310914.9) ## 6 Solanum acaule Bitter POINT (-4354641 -389505.2) ## 7 Solanum acaule Bitter POINT (-4425100 -548771.6) ## 8 Solanum acaule Bitter POINT (-4354226 -588275.4) ## 9 Solanum acaule Bitter POINT (-4667605 73818.71) ## 10 Solanum acaule Bitter POINT (-4485788 -1011814) ``` --- ## Leaflet map (mapview) ```r mapview(occs) ``` <div id="htmlwidget-840b4ac3f583272f0617" style="width:576px;height:432px;" class="leaflet html-widget"></div> <script type="application/json" data-for="htmlwidget-840b4ac3f583272f0617">{"x":{"options":{"minZoom":1,"maxZoom":100,"crs":{"crsClass":"L.CRS.EPSG3857","code":null,"proj4def":null,"projectedBounds":null,"options":{}},"preferCanvas":false,"bounceAtZoomLimits":false,"maxBounds":[[[-90,-370]],[[90,370]]]},"calls":[{"method":"addProviderTiles","args":["CartoDB.Positron",1,"CartoDB.Positron",{"errorTileUrl":"","noWrap":false,"detectRetina":false}]},{"method":"addProviderTiles","args":["CartoDB.DarkMatter",2,"CartoDB.DarkMatter",{"errorTileUrl":"","noWrap":false,"detectRetina":false}]},{"method":"addProviderTiles","args":["OpenStreetMap",3,"OpenStreetMap",{"errorTileUrl":"","noWrap":false,"detectRetina":false}]},{"method":"addProviderTiles","args":["Esri.WorldImagery",4,"Esri.WorldImagery",{"errorTileUrl":"","noWrap":false,"detectRetina":false}]},{"method":"addProviderTiles","args":["OpenTopoMap",5,"OpenTopoMap",{"errorTileUrl":"","noWrap":false,"detectRetina":false}]},{"method":"createMapPane","args":["point",440]},{"method":"addCircleMarkers","args":[[-21.9,-13.5,-24.22,-13.35,-15.23,-17.75,-19.55,-19.25,-17.12,-23.68,-19,-17.42,-15.23,-16.88,-17.37,-17.38,-19.18,-17.62,-17.42,-16.37,-13.68,-16.22,-19.58,-17.38,-15,-23.68,-18.2,-21.8,-17.17,-15.25,-22.9,-16.87,-13.48,-17.05,-22.23,-17.07,-17,-15.92,-22.89,-21.8,-17.38,-16.23,-16.55,-12.5,-17.616667,-19.583334,-17.116667,-17.05,-17.016666],[-66.1,-71,-66.43,-72.07,-68.97,-64.95,-65.42,-64.67,-68.77,-65.63,-65.17,-66,-68.97,-67.13,-66.08,-66.13,-65.25,-66.65,-68.85,-68.03,-71.62,-68.12,-65.75,-66.13,-71.33,-65.63,-67,-65.23,-68.6,-68.97,-66.24,-67.47,-71.03,-67.3,-65.27,-68.65,-68,-68.62,-65.28,-65.23,-66.13,-68.8,-68.67,-72.5,-66.65,-65.75,-68.76667,-68.666664,-68.6],6,null,"occs",{"crs":{"crsClass":"L.CRS.EPSG3857","code":null,"proj4def":null,"projectedBounds":null,"options":{}},"pane":"point","stroke":true,"color":"#333333","weight":2,"opacity":[0.9,0.9,0.9,0.9,0.9,0.9,0.9,0.9,0.9,0.9,0.9,0.9,0.9,0.9,0.9,0.9,0.9,0.9,0.9,0.9,0.9,0.9,0.9,0.9,0.9,0.9,0.9,0.9,0.9,0.9,0.9,0.9,0.9,0.9,0.9,0.9,0.9,0.9,0.9,0.9,0.9,0.9,0.9,0.9,0.9,0.9,0.9,0.9,0.9],"fill":true,"fillColor":["#440154","#440154","#440154","#440154","#440154","#440154","#440154","#440154","#440154","#440154","#440154","#440154","#440154","#440154","#440154","#440154","#440154","#440154","#440154","#440154","#440154","#440154","#440154","#440154","#440154","#440154","#440154","#440154","#440154","#440154","#440154","#440154","#440154","#440154","#440154","#440154","#440154","#440154","#440154","#440154","#440154","#440154","#440154","#440154","#FDE725","#FDE725","#FDE725","#FDE725","#FDE725"],"fillOpacity":[0.6,0.6,0.6,0.6,0.6,0.6,0.6,0.6,0.6,0.6,0.6,0.6,0.6,0.6,0.6,0.6,0.6,0.6,0.6,0.6,0.6,0.6,0.6,0.6,0.6,0.6,0.6,0.6,0.6,0.6,0.6,0.6,0.6,0.6,0.6,0.6,0.6,0.6,0.6,0.6,0.6,0.6,0.6,0.6,0.6,0.6,0.6,0.6,0.6]},null,null,["<html><head><link rel=\"stylesheet\" type=\"text/css\" href=\"lib/popup/popup.css\"><\/head><body><div class=\"scrollableContainer\"><table class=\"popup scrollable\" id=\"popup\"><tr class='coord'><td><\/td><td><b>Feature ID<\/b><\/td><td align='right'>1 <\/td><\/tr><tr class='alt'><td>1<\/td><td><b>species <\/b><\/td><td align='right'>Solanum acaule Bitter <\/td><\/tr><tr><td>2<\/td><td><b>geometry <\/b><\/td><td align='right'>sfc_POINT <\/td><\/tr><\/table><\/div><\/body><\/html>","<html><head><link rel=\"stylesheet\" type=\"text/css\" href=\"lib/popup/popup.css\"><\/head><body><div class=\"scrollableContainer\"><table class=\"popup scrollable\" id=\"popup\"><tr class='coord'><td><\/td><td><b>Feature ID<\/b><\/td><td align='right'>2 <\/td><\/tr><tr class='alt'><td>1<\/td><td><b>species <\/b><\/td><td align='right'>Solanum acaule Bitter <\/td><\/tr><tr><td>2<\/td><td><b>geometry <\/b><\/td><td align='right'>sfc_POINT <\/td><\/tr><\/table><\/div><\/body><\/html>","<html><head><link rel=\"stylesheet\" type=\"text/css\" href=\"lib/popup/popup.css\"><\/head><body><div class=\"scrollableContainer\"><table class=\"popup scrollable\" id=\"popup\"><tr class='coord'><td><\/td><td><b>Feature ID<\/b><\/td><td align='right'>3 <\/td><\/tr><tr class='alt'><td>1<\/td><td><b>species <\/b><\/td><td align='right'>Solanum acaule Bitter <\/td><\/tr><tr><td>2<\/td><td><b>geometry <\/b><\/td><td align='right'>sfc_POINT <\/td><\/tr><\/table><\/div><\/body><\/html>","<html><head><link rel=\"stylesheet\" type=\"text/css\" href=\"lib/popup/popup.css\"><\/head><body><div class=\"scrollableContainer\"><table class=\"popup scrollable\" id=\"popup\"><tr class='coord'><td><\/td><td><b>Feature ID<\/b><\/td><td align='right'>4 <\/td><\/tr><tr class='alt'><td>1<\/td><td><b>species <\/b><\/td><td align='right'>Solanum acaule Bitter <\/td><\/tr><tr><td>2<\/td><td><b>geometry <\/b><\/td><td align='right'>sfc_POINT <\/td><\/tr><\/table><\/div><\/body><\/html>","<html><head><link rel=\"stylesheet\" type=\"text/css\" href=\"lib/popup/popup.css\"><\/head><body><div class=\"scrollableContainer\"><table class=\"popup scrollable\" id=\"popup\"><tr class='coord'><td><\/td><td><b>Feature ID<\/b><\/td><td align='right'>5 <\/td><\/tr><tr class='alt'><td>1<\/td><td><b>species <\/b><\/td><td align='right'>Solanum acaule Bitter <\/td><\/tr><tr><td>2<\/td><td><b>geometry <\/b><\/td><td align='right'>sfc_POINT <\/td><\/tr><\/table><\/div><\/body><\/html>","<html><head><link rel=\"stylesheet\" type=\"text/css\" href=\"lib/popup/popup.css\"><\/head><body><div class=\"scrollableContainer\"><table class=\"popup scrollable\" id=\"popup\"><tr class='coord'><td><\/td><td><b>Feature ID<\/b><\/td><td align='right'>6 <\/td><\/tr><tr class='alt'><td>1<\/td><td><b>species <\/b><\/td><td align='right'>Solanum acaule Bitter <\/td><\/tr><tr><td>2<\/td><td><b>geometry <\/b><\/td><td align='right'>sfc_POINT <\/td><\/tr><\/table><\/div><\/body><\/html>","<html><head><link rel=\"stylesheet\" type=\"text/css\" href=\"lib/popup/popup.css\"><\/head><body><div class=\"scrollableContainer\"><table class=\"popup scrollable\" id=\"popup\"><tr class='coord'><td><\/td><td><b>Feature ID<\/b><\/td><td align='right'>7 <\/td><\/tr><tr class='alt'><td>1<\/td><td><b>species <\/b><\/td><td align='right'>Solanum acaule Bitter <\/td><\/tr><tr><td>2<\/td><td><b>geometry <\/b><\/td><td align='right'>sfc_POINT <\/td><\/tr><\/table><\/div><\/body><\/html>","<html><head><link rel=\"stylesheet\" type=\"text/css\" href=\"lib/popup/popup.css\"><\/head><body><div class=\"scrollableContainer\"><table class=\"popup scrollable\" id=\"popup\"><tr class='coord'><td><\/td><td><b>Feature ID<\/b><\/td><td align='right'>8 <\/td><\/tr><tr class='alt'><td>1<\/td><td><b>species <\/b><\/td><td align='right'>Solanum acaule Bitter <\/td><\/tr><tr><td>2<\/td><td><b>geometry <\/b><\/td><td align='right'>sfc_POINT <\/td><\/tr><\/table><\/div><\/body><\/html>","<html><head><link rel=\"stylesheet\" type=\"text/css\" href=\"lib/popup/popup.css\"><\/head><body><div class=\"scrollableContainer\"><table class=\"popup scrollable\" id=\"popup\"><tr class='coord'><td><\/td><td><b>Feature ID<\/b><\/td><td align='right'>9 <\/td><\/tr><tr class='alt'><td>1<\/td><td><b>species <\/b><\/td><td align='right'>Solanum acaule Bitter <\/td><\/tr><tr><td>2<\/td><td><b>geometry <\/b><\/td><td align='right'>sfc_POINT <\/td><\/tr><\/table><\/div><\/body><\/html>","<html><head><link rel=\"stylesheet\" type=\"text/css\" href=\"lib/popup/popup.css\"><\/head><body><div class=\"scrollableContainer\"><table class=\"popup scrollable\" id=\"popup\"><tr class='coord'><td><\/td><td><b>Feature ID<\/b><\/td><td align='right'>10 <\/td><\/tr><tr class='alt'><td>1<\/td><td><b>species <\/b><\/td><td align='right'>Solanum acaule Bitter <\/td><\/tr><tr><td>2<\/td><td><b>geometry <\/b><\/td><td align='right'>sfc_POINT <\/td><\/tr><\/table><\/div><\/body><\/html>","<html><head><link rel=\"stylesheet\" type=\"text/css\" href=\"lib/popup/popup.css\"><\/head><body><div class=\"scrollableContainer\"><table class=\"popup scrollable\" id=\"popup\"><tr class='coord'><td><\/td><td><b>Feature ID<\/b><\/td><td align='right'>11 <\/td><\/tr><tr class='alt'><td>1<\/td><td><b>species <\/b><\/td><td align='right'>Solanum acaule Bitter <\/td><\/tr><tr><td>2<\/td><td><b>geometry <\/b><\/td><td align='right'>sfc_POINT <\/td><\/tr><\/table><\/div><\/body><\/html>","<html><head><link rel=\"stylesheet\" type=\"text/css\" href=\"lib/popup/popup.css\"><\/head><body><div class=\"scrollableContainer\"><table class=\"popup scrollable\" id=\"popup\"><tr class='coord'><td><\/td><td><b>Feature ID<\/b><\/td><td align='right'>12 <\/td><\/tr><tr class='alt'><td>1<\/td><td><b>species <\/b><\/td><td align='right'>Solanum acaule Bitter <\/td><\/tr><tr><td>2<\/td><td><b>geometry <\/b><\/td><td align='right'>sfc_POINT <\/td><\/tr><\/table><\/div><\/body><\/html>","<html><head><link rel=\"stylesheet\" type=\"text/css\" href=\"lib/popup/popup.css\"><\/head><body><div class=\"scrollableContainer\"><table class=\"popup scrollable\" id=\"popup\"><tr class='coord'><td><\/td><td><b>Feature ID<\/b><\/td><td align='right'>13 <\/td><\/tr><tr class='alt'><td>1<\/td><td><b>species <\/b><\/td><td align='right'>Solanum acaule Bitter <\/td><\/tr><tr><td>2<\/td><td><b>geometry <\/b><\/td><td align='right'>sfc_POINT <\/td><\/tr><\/table><\/div><\/body><\/html>","<html><head><link rel=\"stylesheet\" type=\"text/css\" href=\"lib/popup/popup.css\"><\/head><body><div class=\"scrollableContainer\"><table class=\"popup scrollable\" id=\"popup\"><tr class='coord'><td><\/td><td><b>Feature ID<\/b><\/td><td align='right'>14 <\/td><\/tr><tr class='alt'><td>1<\/td><td><b>species <\/b><\/td><td align='right'>Solanum acaule Bitter <\/td><\/tr><tr><td>2<\/td><td><b>geometry <\/b><\/td><td align='right'>sfc_POINT <\/td><\/tr><\/table><\/div><\/body><\/html>","<html><head><link rel=\"stylesheet\" type=\"text/css\" href=\"lib/popup/popup.css\"><\/head><body><div class=\"scrollableContainer\"><table class=\"popup scrollable\" id=\"popup\"><tr class='coord'><td><\/td><td><b>Feature ID<\/b><\/td><td align='right'>15 <\/td><\/tr><tr class='alt'><td>1<\/td><td><b>species <\/b><\/td><td align='right'>Solanum acaule Bitter <\/td><\/tr><tr><td>2<\/td><td><b>geometry <\/b><\/td><td align='right'>sfc_POINT <\/td><\/tr><\/table><\/div><\/body><\/html>","<html><head><link rel=\"stylesheet\" type=\"text/css\" href=\"lib/popup/popup.css\"><\/head><body><div class=\"scrollableContainer\"><table class=\"popup scrollable\" id=\"popup\"><tr class='coord'><td><\/td><td><b>Feature ID<\/b><\/td><td align='right'>16 <\/td><\/tr><tr class='alt'><td>1<\/td><td><b>species <\/b><\/td><td align='right'>Solanum acaule Bitter <\/td><\/tr><tr><td>2<\/td><td><b>geometry <\/b><\/td><td align='right'>sfc_POINT <\/td><\/tr><\/table><\/div><\/body><\/html>","<html><head><link rel=\"stylesheet\" type=\"text/css\" href=\"lib/popup/popup.css\"><\/head><body><div class=\"scrollableContainer\"><table class=\"popup scrollable\" id=\"popup\"><tr class='coord'><td><\/td><td><b>Feature ID<\/b><\/td><td align='right'>17 <\/td><\/tr><tr class='alt'><td>1<\/td><td><b>species <\/b><\/td><td align='right'>Solanum acaule Bitter <\/td><\/tr><tr><td>2<\/td><td><b>geometry <\/b><\/td><td align='right'>sfc_POINT <\/td><\/tr><\/table><\/div><\/body><\/html>","<html><head><link rel=\"stylesheet\" type=\"text/css\" href=\"lib/popup/popup.css\"><\/head><body><div class=\"scrollableContainer\"><table class=\"popup scrollable\" id=\"popup\"><tr class='coord'><td><\/td><td><b>Feature ID<\/b><\/td><td align='right'>18 <\/td><\/tr><tr class='alt'><td>1<\/td><td><b>species <\/b><\/td><td align='right'>Solanum acaule Bitter <\/td><\/tr><tr><td>2<\/td><td><b>geometry <\/b><\/td><td align='right'>sfc_POINT <\/td><\/tr><\/table><\/div><\/body><\/html>","<html><head><link rel=\"stylesheet\" type=\"text/css\" href=\"lib/popup/popup.css\"><\/head><body><div class=\"scrollableContainer\"><table class=\"popup scrollable\" id=\"popup\"><tr class='coord'><td><\/td><td><b>Feature ID<\/b><\/td><td align='right'>19 <\/td><\/tr><tr class='alt'><td>1<\/td><td><b>species <\/b><\/td><td align='right'>Solanum acaule Bitter <\/td><\/tr><tr><td>2<\/td><td><b>geometry <\/b><\/td><td align='right'>sfc_POINT <\/td><\/tr><\/table><\/div><\/body><\/html>","<html><head><link rel=\"stylesheet\" type=\"text/css\" href=\"lib/popup/popup.css\"><\/head><body><div class=\"scrollableContainer\"><table class=\"popup scrollable\" id=\"popup\"><tr class='coord'><td><\/td><td><b>Feature ID<\/b><\/td><td align='right'>20 <\/td><\/tr><tr class='alt'><td>1<\/td><td><b>species <\/b><\/td><td align='right'>Solanum acaule Bitter <\/td><\/tr><tr><td>2<\/td><td><b>geometry <\/b><\/td><td align='right'>sfc_POINT <\/td><\/tr><\/table><\/div><\/body><\/html>","<html><head><link rel=\"stylesheet\" type=\"text/css\" href=\"lib/popup/popup.css\"><\/head><body><div class=\"scrollableContainer\"><table class=\"popup scrollable\" id=\"popup\"><tr class='coord'><td><\/td><td><b>Feature ID<\/b><\/td><td align='right'>21 <\/td><\/tr><tr class='alt'><td>1<\/td><td><b>species <\/b><\/td><td align='right'>Solanum acaule Bitter <\/td><\/tr><tr><td>2<\/td><td><b>geometry <\/b><\/td><td align='right'>sfc_POINT <\/td><\/tr><\/table><\/div><\/body><\/html>","<html><head><link rel=\"stylesheet\" type=\"text/css\" href=\"lib/popup/popup.css\"><\/head><body><div class=\"scrollableContainer\"><table class=\"popup scrollable\" id=\"popup\"><tr class='coord'><td><\/td><td><b>Feature ID<\/b><\/td><td align='right'>22 <\/td><\/tr><tr class='alt'><td>1<\/td><td><b>species <\/b><\/td><td align='right'>Solanum acaule Bitter <\/td><\/tr><tr><td>2<\/td><td><b>geometry <\/b><\/td><td align='right'>sfc_POINT <\/td><\/tr><\/table><\/div><\/body><\/html>","<html><head><link rel=\"stylesheet\" type=\"text/css\" href=\"lib/popup/popup.css\"><\/head><body><div class=\"scrollableContainer\"><table class=\"popup scrollable\" id=\"popup\"><tr class='coord'><td><\/td><td><b>Feature ID<\/b><\/td><td align='right'>23 <\/td><\/tr><tr class='alt'><td>1<\/td><td><b>species <\/b><\/td><td align='right'>Solanum acaule Bitter <\/td><\/tr><tr><td>2<\/td><td><b>geometry <\/b><\/td><td align='right'>sfc_POINT <\/td><\/tr><\/table><\/div><\/body><\/html>","<html><head><link rel=\"stylesheet\" type=\"text/css\" href=\"lib/popup/popup.css\"><\/head><body><div class=\"scrollableContainer\"><table class=\"popup scrollable\" id=\"popup\"><tr class='coord'><td><\/td><td><b>Feature ID<\/b><\/td><td align='right'>24 <\/td><\/tr><tr class='alt'><td>1<\/td><td><b>species <\/b><\/td><td align='right'>Solanum acaule Bitter <\/td><\/tr><tr><td>2<\/td><td><b>geometry <\/b><\/td><td align='right'>sfc_POINT <\/td><\/tr><\/table><\/div><\/body><\/html>","<html><head><link rel=\"stylesheet\" type=\"text/css\" href=\"lib/popup/popup.css\"><\/head><body><div class=\"scrollableContainer\"><table class=\"popup scrollable\" id=\"popup\"><tr class='coord'><td><\/td><td><b>Feature ID<\/b><\/td><td align='right'>25 <\/td><\/tr><tr class='alt'><td>1<\/td><td><b>species <\/b><\/td><td align='right'>Solanum acaule Bitter <\/td><\/tr><tr><td>2<\/td><td><b>geometry <\/b><\/td><td align='right'>sfc_POINT <\/td><\/tr><\/table><\/div><\/body><\/html>","<html><head><link rel=\"stylesheet\" type=\"text/css\" href=\"lib/popup/popup.css\"><\/head><body><div class=\"scrollableContainer\"><table class=\"popup scrollable\" id=\"popup\"><tr class='coord'><td><\/td><td><b>Feature ID<\/b><\/td><td align='right'>26 <\/td><\/tr><tr class='alt'><td>1<\/td><td><b>species <\/b><\/td><td align='right'>Solanum acaule Bitter <\/td><\/tr><tr><td>2<\/td><td><b>geometry <\/b><\/td><td align='right'>sfc_POINT <\/td><\/tr><\/table><\/div><\/body><\/html>","<html><head><link rel=\"stylesheet\" type=\"text/css\" href=\"lib/popup/popup.css\"><\/head><body><div class=\"scrollableContainer\"><table class=\"popup scrollable\" id=\"popup\"><tr class='coord'><td><\/td><td><b>Feature ID<\/b><\/td><td align='right'>27 <\/td><\/tr><tr class='alt'><td>1<\/td><td><b>species <\/b><\/td><td align='right'>Solanum acaule Bitter <\/td><\/tr><tr><td>2<\/td><td><b>geometry <\/b><\/td><td align='right'>sfc_POINT <\/td><\/tr><\/table><\/div><\/body><\/html>","<html><head><link rel=\"stylesheet\" type=\"text/css\" href=\"lib/popup/popup.css\"><\/head><body><div class=\"scrollableContainer\"><table class=\"popup scrollable\" id=\"popup\"><tr class='coord'><td><\/td><td><b>Feature ID<\/b><\/td><td align='right'>28 <\/td><\/tr><tr class='alt'><td>1<\/td><td><b>species <\/b><\/td><td align='right'>Solanum acaule Bitter <\/td><\/tr><tr><td>2<\/td><td><b>geometry <\/b><\/td><td align='right'>sfc_POINT <\/td><\/tr><\/table><\/div><\/body><\/html>","<html><head><link rel=\"stylesheet\" type=\"text/css\" href=\"lib/popup/popup.css\"><\/head><body><div class=\"scrollableContainer\"><table class=\"popup scrollable\" id=\"popup\"><tr class='coord'><td><\/td><td><b>Feature ID<\/b><\/td><td align='right'>29 <\/td><\/tr><tr class='alt'><td>1<\/td><td><b>species <\/b><\/td><td align='right'>Solanum acaule Bitter <\/td><\/tr><tr><td>2<\/td><td><b>geometry <\/b><\/td><td align='right'>sfc_POINT <\/td><\/tr><\/table><\/div><\/body><\/html>","<html><head><link rel=\"stylesheet\" type=\"text/css\" href=\"lib/popup/popup.css\"><\/head><body><div class=\"scrollableContainer\"><table class=\"popup scrollable\" id=\"popup\"><tr class='coord'><td><\/td><td><b>Feature ID<\/b><\/td><td align='right'>30 <\/td><\/tr><tr class='alt'><td>1<\/td><td><b>species <\/b><\/td><td align='right'>Solanum acaule Bitter <\/td><\/tr><tr><td>2<\/td><td><b>geometry <\/b><\/td><td align='right'>sfc_POINT <\/td><\/tr><\/table><\/div><\/body><\/html>","<html><head><link rel=\"stylesheet\" type=\"text/css\" href=\"lib/popup/popup.css\"><\/head><body><div class=\"scrollableContainer\"><table class=\"popup scrollable\" id=\"popup\"><tr class='coord'><td><\/td><td><b>Feature ID<\/b><\/td><td align='right'>31 <\/td><\/tr><tr class='alt'><td>1<\/td><td><b>species <\/b><\/td><td align='right'>Solanum acaule Bitter <\/td><\/tr><tr><td>2<\/td><td><b>geometry <\/b><\/td><td align='right'>sfc_POINT <\/td><\/tr><\/table><\/div><\/body><\/html>","<html><head><link rel=\"stylesheet\" type=\"text/css\" href=\"lib/popup/popup.css\"><\/head><body><div class=\"scrollableContainer\"><table class=\"popup scrollable\" id=\"popup\"><tr class='coord'><td><\/td><td><b>Feature ID<\/b><\/td><td align='right'>32 <\/td><\/tr><tr class='alt'><td>1<\/td><td><b>species <\/b><\/td><td align='right'>Solanum acaule Bitter <\/td><\/tr><tr><td>2<\/td><td><b>geometry <\/b><\/td><td align='right'>sfc_POINT <\/td><\/tr><\/table><\/div><\/body><\/html>","<html><head><link rel=\"stylesheet\" type=\"text/css\" href=\"lib/popup/popup.css\"><\/head><body><div class=\"scrollableContainer\"><table class=\"popup scrollable\" id=\"popup\"><tr class='coord'><td><\/td><td><b>Feature ID<\/b><\/td><td align='right'>33 <\/td><\/tr><tr class='alt'><td>1<\/td><td><b>species <\/b><\/td><td align='right'>Solanum acaule Bitter <\/td><\/tr><tr><td>2<\/td><td><b>geometry <\/b><\/td><td align='right'>sfc_POINT <\/td><\/tr><\/table><\/div><\/body><\/html>","<html><head><link rel=\"stylesheet\" type=\"text/css\" href=\"lib/popup/popup.css\"><\/head><body><div class=\"scrollableContainer\"><table class=\"popup scrollable\" id=\"popup\"><tr class='coord'><td><\/td><td><b>Feature ID<\/b><\/td><td align='right'>34 <\/td><\/tr><tr class='alt'><td>1<\/td><td><b>species <\/b><\/td><td align='right'>Solanum acaule Bitter <\/td><\/tr><tr><td>2<\/td><td><b>geometry <\/b><\/td><td align='right'>sfc_POINT <\/td><\/tr><\/table><\/div><\/body><\/html>","<html><head><link rel=\"stylesheet\" type=\"text/css\" href=\"lib/popup/popup.css\"><\/head><body><div class=\"scrollableContainer\"><table class=\"popup scrollable\" id=\"popup\"><tr class='coord'><td><\/td><td><b>Feature ID<\/b><\/td><td align='right'>35 <\/td><\/tr><tr class='alt'><td>1<\/td><td><b>species <\/b><\/td><td align='right'>Solanum acaule Bitter <\/td><\/tr><tr><td>2<\/td><td><b>geometry <\/b><\/td><td align='right'>sfc_POINT <\/td><\/tr><\/table><\/div><\/body><\/html>","<html><head><link rel=\"stylesheet\" type=\"text/css\" href=\"lib/popup/popup.css\"><\/head><body><div class=\"scrollableContainer\"><table class=\"popup scrollable\" id=\"popup\"><tr class='coord'><td><\/td><td><b>Feature ID<\/b><\/td><td align='right'>36 <\/td><\/tr><tr class='alt'><td>1<\/td><td><b>species <\/b><\/td><td align='right'>Solanum acaule Bitter <\/td><\/tr><tr><td>2<\/td><td><b>geometry <\/b><\/td><td align='right'>sfc_POINT <\/td><\/tr><\/table><\/div><\/body><\/html>","<html><head><link rel=\"stylesheet\" type=\"text/css\" href=\"lib/popup/popup.css\"><\/head><body><div class=\"scrollableContainer\"><table class=\"popup scrollable\" id=\"popup\"><tr class='coord'><td><\/td><td><b>Feature ID<\/b><\/td><td align='right'>37 <\/td><\/tr><tr class='alt'><td>1<\/td><td><b>species <\/b><\/td><td align='right'>Solanum acaule Bitter <\/td><\/tr><tr><td>2<\/td><td><b>geometry <\/b><\/td><td align='right'>sfc_POINT <\/td><\/tr><\/table><\/div><\/body><\/html>","<html><head><link rel=\"stylesheet\" type=\"text/css\" href=\"lib/popup/popup.css\"><\/head><body><div class=\"scrollableContainer\"><table class=\"popup scrollable\" id=\"popup\"><tr class='coord'><td><\/td><td><b>Feature ID<\/b><\/td><td align='right'>38 <\/td><\/tr><tr class='alt'><td>1<\/td><td><b>species <\/b><\/td><td align='right'>Solanum acaule Bitter <\/td><\/tr><tr><td>2<\/td><td><b>geometry <\/b><\/td><td align='right'>sfc_POINT <\/td><\/tr><\/table><\/div><\/body><\/html>","<html><head><link rel=\"stylesheet\" type=\"text/css\" href=\"lib/popup/popup.css\"><\/head><body><div class=\"scrollableContainer\"><table class=\"popup scrollable\" id=\"popup\"><tr class='coord'><td><\/td><td><b>Feature ID<\/b><\/td><td align='right'>39 <\/td><\/tr><tr class='alt'><td>1<\/td><td><b>species <\/b><\/td><td align='right'>Solanum acaule Bitter <\/td><\/tr><tr><td>2<\/td><td><b>geometry <\/b><\/td><td align='right'>sfc_POINT <\/td><\/tr><\/table><\/div><\/body><\/html>","<html><head><link rel=\"stylesheet\" type=\"text/css\" href=\"lib/popup/popup.css\"><\/head><body><div class=\"scrollableContainer\"><table class=\"popup scrollable\" id=\"popup\"><tr class='coord'><td><\/td><td><b>Feature ID<\/b><\/td><td align='right'>40 <\/td><\/tr><tr class='alt'><td>1<\/td><td><b>species <\/b><\/td><td align='right'>Solanum acaule Bitter <\/td><\/tr><tr><td>2<\/td><td><b>geometry <\/b><\/td><td align='right'>sfc_POINT <\/td><\/tr><\/table><\/div><\/body><\/html>","<html><head><link rel=\"stylesheet\" type=\"text/css\" href=\"lib/popup/popup.css\"><\/head><body><div class=\"scrollableContainer\"><table class=\"popup scrollable\" id=\"popup\"><tr class='coord'><td><\/td><td><b>Feature ID<\/b><\/td><td align='right'>41 <\/td><\/tr><tr class='alt'><td>1<\/td><td><b>species <\/b><\/td><td align='right'>Solanum acaule Bitter <\/td><\/tr><tr><td>2<\/td><td><b>geometry <\/b><\/td><td align='right'>sfc_POINT <\/td><\/tr><\/table><\/div><\/body><\/html>","<html><head><link rel=\"stylesheet\" type=\"text/css\" href=\"lib/popup/popup.css\"><\/head><body><div class=\"scrollableContainer\"><table class=\"popup scrollable\" id=\"popup\"><tr class='coord'><td><\/td><td><b>Feature ID<\/b><\/td><td align='right'>42 <\/td><\/tr><tr class='alt'><td>1<\/td><td><b>species <\/b><\/td><td align='right'>Solanum acaule Bitter <\/td><\/tr><tr><td>2<\/td><td><b>geometry <\/b><\/td><td align='right'>sfc_POINT <\/td><\/tr><\/table><\/div><\/body><\/html>","<html><head><link rel=\"stylesheet\" type=\"text/css\" href=\"lib/popup/popup.css\"><\/head><body><div class=\"scrollableContainer\"><table class=\"popup scrollable\" id=\"popup\"><tr class='coord'><td><\/td><td><b>Feature ID<\/b><\/td><td align='right'>43 <\/td><\/tr><tr class='alt'><td>1<\/td><td><b>species <\/b><\/td><td align='right'>Solanum acaule Bitter <\/td><\/tr><tr><td>2<\/td><td><b>geometry <\/b><\/td><td align='right'>sfc_POINT <\/td><\/tr><\/table><\/div><\/body><\/html>","<html><head><link rel=\"stylesheet\" type=\"text/css\" href=\"lib/popup/popup.css\"><\/head><body><div class=\"scrollableContainer\"><table class=\"popup scrollable\" id=\"popup\"><tr class='coord'><td><\/td><td><b>Feature ID<\/b><\/td><td align='right'>44 <\/td><\/tr><tr class='alt'><td>1<\/td><td><b>species <\/b><\/td><td align='right'>Solanum acaule Bitter <\/td><\/tr><tr><td>2<\/td><td><b>geometry <\/b><\/td><td align='right'>sfc_POINT <\/td><\/tr><\/table><\/div><\/body><\/html>","<html><head><link rel=\"stylesheet\" type=\"text/css\" href=\"lib/popup/popup.css\"><\/head><body><div class=\"scrollableContainer\"><table class=\"popup scrollable\" id=\"popup\"><tr class='coord'><td><\/td><td><b>Feature ID<\/b><\/td><td align='right'>45 <\/td><\/tr><tr class='alt'><td>1<\/td><td><b>species <\/b><\/td><td align='right'>Solanum acaule subsp. acaule <\/td><\/tr><tr><td>2<\/td><td><b>geometry <\/b><\/td><td align='right'>sfc_POINT <\/td><\/tr><\/table><\/div><\/body><\/html>","<html><head><link rel=\"stylesheet\" type=\"text/css\" href=\"lib/popup/popup.css\"><\/head><body><div class=\"scrollableContainer\"><table class=\"popup scrollable\" id=\"popup\"><tr class='coord'><td><\/td><td><b>Feature ID<\/b><\/td><td align='right'>46 <\/td><\/tr><tr class='alt'><td>1<\/td><td><b>species <\/b><\/td><td align='right'>Solanum acaule subsp. acaule <\/td><\/tr><tr><td>2<\/td><td><b>geometry <\/b><\/td><td align='right'>sfc_POINT <\/td><\/tr><\/table><\/div><\/body><\/html>","<html><head><link rel=\"stylesheet\" type=\"text/css\" href=\"lib/popup/popup.css\"><\/head><body><div class=\"scrollableContainer\"><table class=\"popup scrollable\" id=\"popup\"><tr class='coord'><td><\/td><td><b>Feature ID<\/b><\/td><td align='right'>47 <\/td><\/tr><tr class='alt'><td>1<\/td><td><b>species <\/b><\/td><td align='right'>Solanum acaule subsp. acaule <\/td><\/tr><tr><td>2<\/td><td><b>geometry <\/b><\/td><td align='right'>sfc_POINT <\/td><\/tr><\/table><\/div><\/body><\/html>","<html><head><link rel=\"stylesheet\" type=\"text/css\" href=\"lib/popup/popup.css\"><\/head><body><div class=\"scrollableContainer\"><table class=\"popup scrollable\" id=\"popup\"><tr class='coord'><td><\/td><td><b>Feature ID<\/b><\/td><td align='right'>48 <\/td><\/tr><tr class='alt'><td>1<\/td><td><b>species <\/b><\/td><td align='right'>Solanum acaule subsp. acaule <\/td><\/tr><tr><td>2<\/td><td><b>geometry <\/b><\/td><td align='right'>sfc_POINT <\/td><\/tr><\/table><\/div><\/body><\/html>","<html><head><link rel=\"stylesheet\" type=\"text/css\" href=\"lib/popup/popup.css\"><\/head><body><div class=\"scrollableContainer\"><table class=\"popup scrollable\" id=\"popup\"><tr class='coord'><td><\/td><td><b>Feature ID<\/b><\/td><td align='right'>49 <\/td><\/tr><tr class='alt'><td>1<\/td><td><b>species <\/b><\/td><td align='right'>Solanum acaule subsp. acaule <\/td><\/tr><tr><td>2<\/td><td><b>geometry <\/b><\/td><td align='right'>sfc_POINT <\/td><\/tr><\/table><\/div><\/body><\/html>"],{"maxWidth":800,"minWidth":50,"autoPan":true,"keepInView":false,"closeButton":true,"closeOnClick":true,"className":""},["Solanum acaule Bitter","Solanum acaule Bitter","Solanum acaule Bitter","Solanum acaule Bitter","Solanum acaule Bitter","Solanum acaule Bitter","Solanum acaule Bitter","Solanum acaule Bitter","Solanum acaule Bitter","Solanum acaule Bitter","Solanum acaule Bitter","Solanum acaule Bitter","Solanum acaule Bitter","Solanum acaule Bitter","Solanum acaule Bitter","Solanum acaule Bitter","Solanum acaule Bitter","Solanum acaule Bitter","Solanum acaule Bitter","Solanum acaule Bitter","Solanum acaule Bitter","Solanum acaule Bitter","Solanum acaule Bitter","Solanum acaule Bitter","Solanum acaule Bitter","Solanum acaule Bitter","Solanum acaule Bitter","Solanum acaule Bitter","Solanum acaule Bitter","Solanum acaule Bitter","Solanum acaule Bitter","Solanum acaule Bitter","Solanum acaule Bitter","Solanum acaule Bitter","Solanum acaule Bitter","Solanum acaule Bitter","Solanum acaule Bitter","Solanum acaule Bitter","Solanum acaule Bitter","Solanum acaule Bitter","Solanum acaule Bitter","Solanum acaule Bitter","Solanum acaule Bitter","Solanum acaule Bitter","Solanum acaule subsp. acaule","Solanum acaule subsp. acaule","Solanum acaule subsp. acaule","Solanum acaule subsp. acaule","Solanum acaule subsp. acaule"],{"interactive":false,"permanent":false,"direction":"auto","opacity":1,"offset":[0,0],"textsize":"10px","textOnly":false,"className":"","sticky":true},null]},{"method":"addScaleBar","args":[{"maxWidth":100,"metric":true,"imperial":true,"updateWhenIdle":true,"position":"bottomleft"}]},{"method":"addHomeButton","args":[-72.5,-24.22,-64.67,-12.5,"Zoom to occs","<strong> occs <\/strong>","bottomright"]},{"method":"addLayersControl","args":[["CartoDB.Positron","CartoDB.DarkMatter","OpenStreetMap","Esri.WorldImagery","OpenTopoMap"],"occs",{"collapsed":true,"autoZIndex":true,"position":"topleft"}]},{"method":"addLegend","args":[{"colors":["#440154","#FDE725"],"labels":["Solanum acaule Bitter","Solanum acaule subsp. acaule"],"na_color":null,"na_label":"NA","opacity":1,"position":"topright","type":"factor","title":"occs","extra":null,"layerId":null,"className":"info legend","group":"occs"}]}],"limits":{"lat":[-24.22,-12.5],"lng":[-72.5,-64.67]}},"evals":[],"jsHooks":{"render":[{"code":"function(el, x, data) {\n return (\n function(el, x, data) {\n // get the leaflet map\n var map = this; //HTMLWidgets.find('#' + el.id);\n // we need a new div element because we have to handle\n // the mouseover output separately\n // debugger;\n function addElement () {\n // generate new div Element\n var newDiv = $(document.createElement('div'));\n // append at end of leaflet htmlwidget container\n $(el).append(newDiv);\n //provide ID and style\n newDiv.addClass('lnlt');\n newDiv.css({\n 'position': 'relative',\n 'bottomleft': '0px',\n 'background-color': 'rgba(255, 255, 255, 0.7)',\n 'box-shadow': '0 0 2px #bbb',\n 'background-clip': 'padding-box',\n 'margin': '0',\n 'padding-left': '5px',\n 'color': '#333',\n 'font': '9px/1.5 \"Helvetica Neue\", Arial, Helvetica, sans-serif',\n 'z-index': '700',\n });\n return newDiv;\n }\n\n\n // check for already existing lnlt class to not duplicate\n var lnlt = $(el).find('.lnlt');\n\n if(!lnlt.length) {\n lnlt = addElement();\n\n // grab the special div we generated in the beginning\n // and put the mousmove output there\n\n map.on('mousemove', function (e) {\n if (e.originalEvent.ctrlKey) {\n if (document.querySelector('.lnlt') === null) lnlt = addElement();\n lnlt.text(\n ' lon: ' + (e.latlng.lng).toFixed(5) +\n ' | lat: ' + (e.latlng.lat).toFixed(5) +\n ' | zoom: ' + map.getZoom() +\n ' | x: ' + L.CRS.EPSG3857.project(e.latlng).x.toFixed(0) +\n ' | y: ' + L.CRS.EPSG3857.project(e.latlng).y.toFixed(0) +\n ' | epsg: 3857 ' +\n ' | proj4: +proj=merc +a=6378137 +b=6378137 +lat_ts=0.0 +lon_0=0.0 +x_0=0.0 +y_0=0 +k=1.0 +units=m +nadgrids=@null +no_defs ');\n } else {\n if (document.querySelector('.lnlt') === null) lnlt = addElement();\n lnlt.text(\n ' lon: ' + (e.latlng.lng).toFixed(5) +\n ' | lat: ' + (e.latlng.lat).toFixed(5) +\n ' | zoom: ' + map.getZoom() + ' ');\n }\n });\n\n // remove the lnlt div when mouse leaves map\n map.on('mouseout', function (e) {\n var strip = document.querySelector('.lnlt');\n strip.remove();\n });\n\n };\n\n //$(el).keypress(67, function(e) {\n map.on('preclick', function(e) {\n if (e.originalEvent.ctrlKey) {\n if (document.querySelector('.lnlt') === null) lnlt = addElement();\n lnlt.text(\n ' lon: ' + (e.latlng.lng).toFixed(5) +\n ' | lat: ' + (e.latlng.lat).toFixed(5) +\n ' | zoom: ' + map.getZoom() + ' ');\n var txt = document.querySelector('.lnlt').textContent;\n console.log(txt);\n //txt.innerText.focus();\n //txt.select();\n setClipboardText('\"' + txt + '\"');\n }\n });\n\n //map.on('click', function (e) {\n // var txt = document.querySelector('.lnlt').textContent;\n // console.log(txt);\n // //txt.innerText.focus();\n // //txt.select();\n // setClipboardText(txt);\n //});\n\n function setClipboardText(text){\n var id = 'mycustom-clipboard-textarea-hidden-id';\n var existsTextarea = document.getElementById(id);\n\n if(!existsTextarea){\n console.log('Creating textarea');\n var textarea = document.createElement('textarea');\n textarea.id = id;\n // Place in top-left corner of screen regardless of scroll position.\n textarea.style.position = 'fixed';\n textarea.style.top = 0;\n textarea.style.left = 0;\n\n // Ensure it has a small width and height. Setting to 1px / 1em\n // doesn't work as this gives a negative w/h on some browsers.\n textarea.style.width = '1px';\n textarea.style.height = '1px';\n\n // We don't need padding, reducing the size if it does flash render.\n textarea.style.padding = 0;\n\n // Clean up any borders.\n textarea.style.border = 'none';\n textarea.style.outline = 'none';\n textarea.style.boxShadow = 'none';\n\n // Avoid flash of white box if rendered for any reason.\n textarea.style.background = 'transparent';\n document.querySelector('body').appendChild(textarea);\n console.log('The textarea now exists :)');\n existsTextarea = document.getElementById(id);\n }else{\n console.log('The textarea already exists :3')\n }\n\n existsTextarea.value = text;\n existsTextarea.select();\n\n try {\n var status = document.execCommand('copy');\n if(!status){\n console.error('Cannot copy text');\n }else{\n console.log('The text is now on the clipboard');\n }\n } catch (err) {\n console.log('Unable to copy.');\n }\n }\n\n\n }\n ).call(this.getMap(), el, x, data);\n}","data":null}]}}</script> --- ## Leaflet map (leaflet) ```r leaflet(occs) %>% addTiles() %>% addMarkers(popup = ~species) ``` <div id="htmlwidget-f22fcf0f97a96ce913f1" style="width:576px;height:480px;" class="leaflet html-widget"></div> <script type="application/json" data-for="htmlwidget-f22fcf0f97a96ce913f1">{"x":{"options":{"crs":{"crsClass":"L.CRS.EPSG3857","code":null,"proj4def":null,"projectedBounds":null,"options":{}}},"calls":[{"method":"addTiles","args":["//{s}.tile.openstreetmap.org/{z}/{x}/{y}.png",null,null,{"minZoom":0,"maxZoom":18,"tileSize":256,"subdomains":"abc","errorTileUrl":"","tms":false,"noWrap":false,"zoomOffset":0,"zoomReverse":false,"opacity":1,"zIndex":1,"detectRetina":false,"attribution":"© <a href=\"http://openstreetmap.org\">OpenStreetMap<\/a> contributors, <a href=\"http://creativecommons.org/licenses/by-sa/2.0/\">CC-BY-SA<\/a>"}]},{"method":"addMarkers","args":[[-21.9,-13.5,-24.22,-13.35,-15.23,-17.75,-19.55,-19.25,-17.12,-23.68,-19,-17.42,-15.23,-16.88,-17.37,-17.38,-19.18,-17.62,-17.42,-16.37,-13.68,-16.22,-19.58,-17.38,-15,-23.68,-18.2,-21.8,-17.17,-15.25,-22.9,-16.87,-13.48,-17.05,-22.23,-17.07,-17,-15.92,-22.89,-21.8,-17.38,-16.23,-16.55,-12.5,-17.616667,-19.583334,-17.116667,-17.05,-17.016666],[-66.1,-71,-66.43,-72.07,-68.97,-64.95,-65.42,-64.67,-68.77,-65.63,-65.17,-66,-68.97,-67.13,-66.08,-66.13,-65.25,-66.65,-68.85,-68.03,-71.62,-68.12,-65.75,-66.13,-71.33,-65.63,-67,-65.23,-68.6,-68.97,-66.24,-67.47,-71.03,-67.3,-65.27,-68.65,-68,-68.62,-65.28,-65.23,-66.13,-68.8,-68.67,-72.5,-66.65,-65.75,-68.76667,-68.666664,-68.6],null,null,null,{"interactive":true,"draggable":false,"keyboard":true,"title":"","alt":"","zIndexOffset":0,"opacity":1,"riseOnHover":false,"riseOffset":250},["Solanum acaule Bitter","Solanum acaule Bitter","Solanum acaule Bitter","Solanum acaule Bitter","Solanum acaule Bitter","Solanum acaule Bitter","Solanum acaule Bitter","Solanum acaule Bitter","Solanum acaule Bitter","Solanum acaule Bitter","Solanum acaule Bitter","Solanum acaule Bitter","Solanum acaule Bitter","Solanum acaule Bitter","Solanum acaule Bitter","Solanum acaule Bitter","Solanum acaule Bitter","Solanum acaule Bitter","Solanum acaule Bitter","Solanum acaule Bitter","Solanum acaule Bitter","Solanum acaule Bitter","Solanum acaule Bitter","Solanum acaule Bitter","Solanum acaule Bitter","Solanum acaule Bitter","Solanum acaule Bitter","Solanum acaule Bitter","Solanum acaule Bitter","Solanum acaule Bitter","Solanum acaule Bitter","Solanum acaule Bitter","Solanum acaule Bitter","Solanum acaule Bitter","Solanum acaule Bitter","Solanum acaule Bitter","Solanum acaule Bitter","Solanum acaule Bitter","Solanum acaule Bitter","Solanum acaule Bitter","Solanum acaule Bitter","Solanum acaule Bitter","Solanum acaule Bitter","Solanum acaule Bitter","Solanum acaule subsp. acaule","Solanum acaule subsp. acaule","Solanum acaule subsp. acaule","Solanum acaule subsp. acaule","Solanum acaule subsp. acaule"],null,null,null,null,{"interactive":false,"permanent":false,"direction":"auto","opacity":1,"offset":[0,0],"textsize":"10px","textOnly":false,"className":"","sticky":true},null]}],"limits":{"lat":[-24.22,-12.5],"lng":[-72.5,-64.67]}},"evals":[],"jsHooks":[]}</script> <small>https://rstudio.github.io/leaflet/</small> --- ## Plotting with ggspatial ```r library(ggspatial) ggplot() + annotation_map_tile() + layer_spatial(occs, size = 5, aes(colour = species)) ``` <!-- --> <small>Basemap Copyright OpenStreetMap Contributors CC-BY-SA</small> --- ## Plotting with ggspatial ```r ggplot() + annotation_map_tile(type = "stamenwatercolor") + layer_spatial(occs, size = 5) ``` <!-- --> <small>Basemap Copyright OpenStreetMap Contributors CC-BY-SA</small> --- ## Convert sf to Spatial* object (sp) ```r occs.sp <- as(occs, "Spatial") occs.sp ``` ``` ## class : SpatialPointsDataFrame ## features : 49 ## extent : -72.5, -64.67, -24.22, -12.5 (xmin, xmax, ymin, ymax) ## coord. ref. : +proj=longlat +datum=WGS84 +no_defs +ellps=WGS84 +towgs84=0,0,0 ## variables : 1 ## names : species ## min values : Solanum acaule Bitter ## max values : Solanum acaule subsp. acaule ``` --- class: inverse, middle, center # How to save/export vector data? --- ## Saving vector data ```r st_write(countries, "data/countries.gpkg", delete_dsn = TRUE) ``` ``` ## Deleting source `data/countries.gpkg' using driver `GPKG' ## Writing layer `countries' to data source `data/countries.gpkg' using driver `GPKG' ## features: 38 ## fields: 4 ## geometry type: Multi Polygon ``` --- class: inverse, middle, center # Geocoding --- ## Geocoding ```r myplace <- tmaptools::geocode_OSM("Granada, Spain") myplace ``` ``` ## $query ## [1] "Granada, Spain" ## ## $coords ## x y ## -3.602193 37.183054 ## ## $bbox ## xmin ymin xmax ymax ## -3.700362 37.136703 -3.496324 37.225017 ``` Other packages: opencage, dismo, ggmap, geocodeHERE, rmapzen... --- class: inverse, middle, center # Raster data --- ## Download raster (and vector) data ```r library(raster) bioclim <- getData('worldclim', var = "bio", res = 10) bioclim ``` ``` ## class : RasterStack ## dimensions : 900, 2160, 1944000, 19 (nrow, ncol, ncell, nlayers) ## resolution : 0.1666667, 0.1666667 (x, y) ## extent : -180, 180, -60, 90 (xmin, xmax, ymin, ymax) ## coord. ref. : +proj=longlat +datum=WGS84 +ellps=WGS84 +towgs84=0,0,0 ## names : bio1, bio2, bio3, bio4, bio5, bio6, bio7, bio8, bio9, bio10, bio11, bio12, bio13, bio14, bio15, ... ## min values : -269, 9, 8, 72, -59, -547, 53, -251, -450, -97, -488, 0, 0, 0, 0, ... ## max values : 314, 211, 95, 22673, 489, 258, 725, 375, 364, 380, 289, 9916, 2088, 652, 261, ... ``` --- ## Importing raster data from disk One grid only (1 layer): ```r ras <- raster("wc10/bio1.bil") ras ``` ``` ## class : RasterLayer ## dimensions : 900, 2160, 1944000 (nrow, ncol, ncell) ## resolution : 0.1666667, 0.1666667 (x, y) ## extent : -180, 180, -60, 90 (xmin, xmax, ymin, ymax) ## coord. ref. : +proj=longlat +datum=WGS84 +no_defs +ellps=WGS84 +towgs84=0,0,0 ## data source : C:/Users/FRS/Dropbox/Rcode/myRcode/courses_talks/GISwithR/wc10/bio1.bil ## names : bio1 ## values : -269, 314 (min, max) ``` --- ## Importing raster data from disk Multiple grids: ```r files <- list.files("wc10", pattern = "bio\\d+.bil", full.names = TRUE) manylayers <- stack(files) manylayers ``` ``` ## class : RasterStack ## dimensions : 900, 2160, 1944000, 19 (nrow, ncol, ncell, nlayers) ## resolution : 0.1666667, 0.1666667 (x, y) ## extent : -180, 180, -60, 90 (xmin, xmax, ymin, ymax) ## coord. ref. : +proj=longlat +datum=WGS84 +no_defs +ellps=WGS84 +towgs84=0,0,0 ## names : bio1, bio10, bio11, bio12, bio13, bio14, bio15, bio16, bio17, bio18, bio19, bio2, bio3, bio4, bio5, ... ## min values : -269, -97, -488, 0, 0, 0, 0, 0, 0, 0, 0, 9, 8, 72, -59, ... ## max values : 314, 380, 289, 9916, 2088, 652, 261, 5043, 2159, 4001, 3985, 211, 95, 22673, 489, ... ``` --- ## Setting the projection (Coordinate Reference System) ```r crs(ras) <- "+proj=longlat +ellps=WGS84 +datum=WGS84" ``` See http://spatialreference.org To change projection: `projectRaster` --- ## Basic raster plotting ```r plot(ras) ``` <!-- --> --- ## rasterVis ```r library(rasterVis) levelplot(ras, margin = FALSE) ``` <!-- --> --- ## Crop (change extent) ```r ras.crop <- crop(ras, countries) plot(ras.crop) ``` <!-- --> --- ## Plot raster with ggplot2 ```r ras.df <- as.data.frame(ras.crop, xy = TRUE) ggplot(ras.df) + geom_raster(aes(x = x, y = y, fill = bio1)) ``` <!-- --> --- ## Change resolution ```r ras.coarse <- aggregate(ras.crop, fact = 4, fun = mean) ras.coarse ``` ``` ## class : RasterLayer ## dimensions : 69, 97, 6693 (nrow, ncol, ncell) ## resolution : 0.6666667, 0.6666667 (x, y) ## extent : -24.33333, 40.33333, 34.66667, 80.66667 (xmin, xmax, ymin, ymax) ## coord. ref. : +proj=longlat +ellps=WGS84 +datum=WGS84 +towgs84=0,0,0 ## data source : in memory ## names : bio1 ## values : -206.375, 194 (min, max) ``` --- ## Extract values from rasters ```r vals <- extract(ras, occs) head(vals) ``` ``` ## [1] 88 100 52 98 86 154 ``` --- ## Extract values from rasters ```r vals <- extract(ras, countries, fun = mean) head(vals) ``` ``` ## [,1] ## [1,] 118.00000 ## [2,] 57.86376 ## [3,] 95.43704 ## [4,] 102.15935 ## [5,] 90.21891 ## [6,] 62.47996 ``` --- ## Save raster data ```r writeRaster(ras, filename = "myraster.grd") ``` KML (Google Earth): ```r KML(ras, filename = "myraster.kmz", overwrite = TRUE) ``` --- ## Remote sensing too  http://bleutner.github.io/RStoolbox/ And many more packages! (MODIS, Landsat, LiDAR...) --- ## Why doing GIS in R - Harness all **stats & data management power** from R - Data wrangling - Modelling - Dataviz - Fully-**reproducible** scripts --- ## Running GIS geoprocessing algorithms from R - RQGIS - rgrass7 - RSAGA - ArcGIS <img src="images/R_ArcGis.png" width="360px" height="240px" /> --- ## Some tutorials - https://geocompr.robinlovelace.net/ - https://bhaskarvk.github.io/user2017.geodataviz/ - https://github.com/Nowosad/gis_with_r_how_to_start - http://www.rspatial.org/ - http://r-spatial.github.io/sf/ - http://book.ecosens.org/ - http://pakillo.github.io/R-GIS-tutorial - https://datacarpentry.org/geospatial-workshop/ - http://jafflerbach.github.io/spatial-analysis-R/intro_spatial_data_R.html - https://github.com/USEPA/intro_gis_with_r - http://www.nickeubank.com/gis-in-r/ - [Spatial R cheatsheet](https://github.com/wegmann/RSdocs/blob/master/RSecology_cheatsheet/RS_ecology_refcard.pdf) - etc --- class: inverse, middle, center # Exercises --- ## Map distribution of species occurrences (rgbif) <!-- --> --- ## Geocode and map address Interactive map <div id="htmlwidget-099293d578ffcbc4367d" style="width:576px;height:432px;" class="leaflet html-widget"></div> <script type="application/json" data-for="htmlwidget-099293d578ffcbc4367d">{"x":{"options":{"minZoom":1,"maxZoom":100,"crs":{"crsClass":"L.CRS.EPSG3857","code":null,"proj4def":null,"projectedBounds":null,"options":{}},"preferCanvas":false,"bounceAtZoomLimits":false,"maxBounds":[[[-90,-370]],[[90,370]]]},"calls":[{"method":"addProviderTiles","args":["CartoDB.Positron",1,"CartoDB.Positron",{"errorTileUrl":"","noWrap":false,"detectRetina":false}]},{"method":"addProviderTiles","args":["CartoDB.DarkMatter",2,"CartoDB.DarkMatter",{"errorTileUrl":"","noWrap":false,"detectRetina":false}]},{"method":"addProviderTiles","args":["OpenStreetMap",3,"OpenStreetMap",{"errorTileUrl":"","noWrap":false,"detectRetina":false}]},{"method":"addProviderTiles","args":["Esri.WorldImagery",4,"Esri.WorldImagery",{"errorTileUrl":"","noWrap":false,"detectRetina":false}]},{"method":"addProviderTiles","args":["OpenTopoMap",5,"OpenTopoMap",{"errorTileUrl":"","noWrap":false,"detectRetina":false}]},{"method":"createMapPane","args":["point",440]},{"method":"addCircleMarkers","args":[28.27,-16.64,6,null,"loc",{"crs":{"crsClass":"L.CRS.EPSG3857","code":null,"proj4def":null,"projectedBounds":null,"options":{}},"pane":"point","stroke":true,"color":"#333333","weight":2,"opacity":0.9,"fill":true,"fillColor":"#6666FF","fillOpacity":0.6},null,null,"<html><head><link rel=\"stylesheet\" type=\"text/css\" href=\"lib/popup/popup.css\"><\/head><body><div class=\"scrollableContainer\"><table class=\"popup scrollable\" id=\"popup\"><tr class='coord'><td><\/td><td><b>Feature ID<\/b><\/td><td align='right'>1 <\/td><\/tr><tr class='alt'><td>1<\/td><td><b>geometry <\/b><\/td><td align='right'>sfc_POINT <\/td><\/tr><\/table><\/div><\/body><\/html>",{"maxWidth":800,"minWidth":50,"autoPan":true,"keepInView":false,"closeButton":true,"closeOnClick":true,"className":""},"1",{"interactive":false,"permanent":false,"direction":"auto","opacity":1,"offset":[0,0],"textsize":"10px","textOnly":false,"className":"","sticky":true},null]},{"method":"addScaleBar","args":[{"maxWidth":100,"metric":true,"imperial":true,"updateWhenIdle":true,"position":"bottomleft"}]},{"method":"addHomeButton","args":[-16.64,28.27,-16.64,28.27,"Zoom to loc","<strong> loc <\/strong>","bottomright"]},{"method":"addLayersControl","args":[["CartoDB.Positron","CartoDB.DarkMatter","OpenStreetMap","Esri.WorldImagery","OpenTopoMap"],"loc",{"collapsed":true,"autoZIndex":true,"position":"topleft"}]},{"method":"addLegend","args":[{"colors":["#6666FF"],"labels":["loc"],"na_color":null,"na_label":"NA","opacity":1,"position":"topright","type":"factor","title":"loc","extra":null,"layerId":null,"className":"info legend","group":"loc"}]}],"limits":{"lat":[28.27,28.27],"lng":[-16.64,-16.64]},"setView":[[28.27,-16.64],9,[]]},"evals":[],"jsHooks":{"render":[{"code":"function(el, x, data) {\n return (\n function(el, x, data) {\n // get the leaflet map\n var map = this; //HTMLWidgets.find('#' + el.id);\n // we need a new div element because we have to handle\n // the mouseover output separately\n // debugger;\n function addElement () {\n // generate new div Element\n var newDiv = $(document.createElement('div'));\n // append at end of leaflet htmlwidget container\n $(el).append(newDiv);\n //provide ID and style\n newDiv.addClass('lnlt');\n newDiv.css({\n 'position': 'relative',\n 'bottomleft': '0px',\n 'background-color': 'rgba(255, 255, 255, 0.7)',\n 'box-shadow': '0 0 2px #bbb',\n 'background-clip': 'padding-box',\n 'margin': '0',\n 'padding-left': '5px',\n 'color': '#333',\n 'font': '9px/1.5 \"Helvetica Neue\", Arial, Helvetica, sans-serif',\n 'z-index': '700',\n });\n return newDiv;\n }\n\n\n // check for already existing lnlt class to not duplicate\n var lnlt = $(el).find('.lnlt');\n\n if(!lnlt.length) {\n lnlt = addElement();\n\n // grab the special div we generated in the beginning\n // and put the mousmove output there\n\n map.on('mousemove', function (e) {\n if (e.originalEvent.ctrlKey) {\n if (document.querySelector('.lnlt') === null) lnlt = addElement();\n lnlt.text(\n ' lon: ' + (e.latlng.lng).toFixed(5) +\n ' | lat: ' + (e.latlng.lat).toFixed(5) +\n ' | zoom: ' + map.getZoom() +\n ' | x: ' + L.CRS.EPSG3857.project(e.latlng).x.toFixed(0) +\n ' | y: ' + L.CRS.EPSG3857.project(e.latlng).y.toFixed(0) +\n ' | epsg: 3857 ' +\n ' | proj4: +proj=merc +a=6378137 +b=6378137 +lat_ts=0.0 +lon_0=0.0 +x_0=0.0 +y_0=0 +k=1.0 +units=m +nadgrids=@null +no_defs ');\n } else {\n if (document.querySelector('.lnlt') === null) lnlt = addElement();\n lnlt.text(\n ' lon: ' + (e.latlng.lng).toFixed(5) +\n ' | lat: ' + (e.latlng.lat).toFixed(5) +\n ' | zoom: ' + map.getZoom() + ' ');\n }\n });\n\n // remove the lnlt div when mouse leaves map\n map.on('mouseout', function (e) {\n var strip = document.querySelector('.lnlt');\n strip.remove();\n });\n\n };\n\n //$(el).keypress(67, function(e) {\n map.on('preclick', function(e) {\n if (e.originalEvent.ctrlKey) {\n if (document.querySelector('.lnlt') === null) lnlt = addElement();\n lnlt.text(\n ' lon: ' + (e.latlng.lng).toFixed(5) +\n ' | lat: ' + (e.latlng.lat).toFixed(5) +\n ' | zoom: ' + map.getZoom() + ' ');\n var txt = document.querySelector('.lnlt').textContent;\n console.log(txt);\n //txt.innerText.focus();\n //txt.select();\n setClipboardText('\"' + txt + '\"');\n }\n });\n\n //map.on('click', function (e) {\n // var txt = document.querySelector('.lnlt').textContent;\n // console.log(txt);\n // //txt.innerText.focus();\n // //txt.select();\n // setClipboardText(txt);\n //});\n\n function setClipboardText(text){\n var id = 'mycustom-clipboard-textarea-hidden-id';\n var existsTextarea = document.getElementById(id);\n\n if(!existsTextarea){\n console.log('Creating textarea');\n var textarea = document.createElement('textarea');\n textarea.id = id;\n // Place in top-left corner of screen regardless of scroll position.\n textarea.style.position = 'fixed';\n textarea.style.top = 0;\n textarea.style.left = 0;\n\n // Ensure it has a small width and height. Setting to 1px / 1em\n // doesn't work as this gives a negative w/h on some browsers.\n textarea.style.width = '1px';\n textarea.style.height = '1px';\n\n // We don't need padding, reducing the size if it does flash render.\n textarea.style.padding = 0;\n\n // Clean up any borders.\n textarea.style.border = 'none';\n textarea.style.outline = 'none';\n textarea.style.boxShadow = 'none';\n\n // Avoid flash of white box if rendered for any reason.\n textarea.style.background = 'transparent';\n document.querySelector('body').appendChild(textarea);\n console.log('The textarea now exists :)');\n existsTextarea = document.getElementById(id);\n }else{\n console.log('The textarea already exists :3')\n }\n\n existsTextarea.value = text;\n existsTextarea.select();\n\n try {\n var status = document.execCommand('copy');\n if(!status){\n console.error('Cannot copy text');\n }else{\n console.log('The text is now on the clipboard');\n }\n } catch (err) {\n console.log('Unable to copy.');\n }\n }\n\n\n }\n ).call(this.getMap(), el, x, data);\n}","data":null}]}}</script> --- ## January Precipitation in Spain (raster) <!-- --> --- ## January Precipitation in Spain (leaflet) <div id="htmlwidget-127388867b5f132c2007" style="width:576px;height:432px;" class="leaflet html-widget"></div> <script type="application/json" data-for="htmlwidget-127388867b5f132c2007">{"x":{"options":{"minZoom":1,"maxZoom":100,"crs":{"crsClass":"L.CRS.EPSG3857","code":null,"proj4def":null,"projectedBounds":null,"options":{}},"preferCanvas":false,"bounceAtZoomLimits":false,"maxBounds":[[[-90,-370]],[[90,370]]]},"calls":[{"method":"addProviderTiles","args":["CartoDB.Positron",1,"CartoDB.Positron",{"errorTileUrl":"","noWrap":false,"detectRetina":false}]},{"method":"addProviderTiles","args":["CartoDB.DarkMatter",2,"CartoDB.DarkMatter",{"errorTileUrl":"","noWrap":false,"detectRetina":false}]},{"method":"addProviderTiles","args":["OpenStreetMap",3,"OpenStreetMap",{"errorTileUrl":"","noWrap":false,"detectRetina":false}]},{"method":"addProviderTiles","args":["Esri.WorldImagery",4,"Esri.WorldImagery",{"errorTileUrl":"","noWrap":false,"detectRetina":false}]},{"method":"addProviderTiles","args":["OpenTopoMap",5,"OpenTopoMap",{"errorTileUrl":"","noWrap":false,"detectRetina":false}]},{"method":"addRasterImage","args":["data:image/png;base64,iVBORw0KGgoAAAANSUhEUgAAAFgAAAA8CAYAAADi8H14AAAa0UlEQVR4nN2cbaxs13nXf8962Xtmztt9seO8VHUJUT+gQhFCQgIkJL4BN62pSqW2KaG0IaA2TUJLEBA0OLSJEiKi1qVqWtIkpBRiO4ljJ+UL8od+qECKaFSkBgRNW6d27Pvie+85Z2b23uvl4cNae88cX9u5dn3rkiUdzZyZPXv2/q9n/df/eRt5/PHH/xX/n4///Y/+8zKqELMhZGHIQp8NSSFkQRWSQgaygtbPZQWtrw8JYj1OFURgyErISlJFROhSotNIRtk3DTdzB0CUxGvMPl6EIWesCFaEpIp7tUB5pYcXRUXJQr1BRbU8RhWgAJp2QN19bfzfSHmeFJKWqUhaPjSzFq+GISeyKnfZOTfTwAHtBKiIbK/JyDcHwI3JGClgZAyeTFJDEpnAjAoxl0elAGsqFqpgAARC3oIbFbSCHFWxqsyMIeQyHSLCkW1IWqw85IwTwRqDERC+WQC2CVMXvgIpW6yAQREEU18fQR6pAgrIhh36qK8L4EUI9bkB+pwJqmg9b1JlYQ3rlAk5Y0QmCy7n/yahiMYkADKCU8EbMy3XccnDFuSk28/uPt8dRqR+okzQSAFJFSsGW4EMdaa8MVCPy2wt/5sC4D0fGJIlqcGJIrJFbbTKlMufUjlXnx9ZIzK9Nx5hRTAoWulFRPB1Iwuq9f36ffWxUMw3gQV37/mlpTWKVyFpZkgWoFrR1mozWxpIqlVNVN6ufCzI9No4jJT3sxZgnWwt2gh4BDtyOUyqI6oSyLcH8PFPfmwJcBIaumRZRcef++j33f8K4PNHHlbGDUcxUuBRFVSFpELKsmO1VUFUcLMyLeekYGUkhS1oRgrsxbI5MwECzKxMnwsZkihDLjyd9DYAPvmpf78clcfCRVSFQZQv/ejDyy4bhiQEhZRlkjtdqjtx3i6Ztz503x2dEFUhj39spdd4HSM9xLpJ7SqEtEMXplrm+NxW2Uc9V8jje+BE8Aa82Vr5OCJKfD4L7v/pR5ftB99+//jcYHF1lxYXaEwiqTBkQ1BlZhWSQYxCljNfMo6s8PHvfWSZlOmCoFjMwsLcKXsus7CZc82AFWXuInt+4HC2niRYd/+7p0k69zMfXJ5s5gQaMsVaQzaEbIhZCHXCY/0LugU562i1o7QrQ+p7TirQO/cwSretBRfQTb2P3fvOO5+bAL78rk8uvcksPKz/yS8vX3NwE7VzABa+x4jSR481mdYmZjYhk5iHLtVZTuXCEuXGxouzUmZ9ZstFBd1eTLn4AkiXLI3JuGxI2RCSQ0TLMn3vA0srGe8i2QrWZKzJpOQI2dIny5ANfTYEFYYkxB1QY+XeXRDK9+dJzmUp1+GkeHNaPxd3dLGIINVKy+TeqkZMnQAH8PQ7/8MSBCuZxkbmswHvIkeLFd3Q4GyRQeuhZRUakgozm2hM5vrg2XOJoI4WxdUltYrQ1y9rzfZiD1y5qRC2Mz8kqZdjiSrMbK6AC11yWClAelOuDyDWzUxEyfXYqMVyd613V/NCmeS0A/JWMRQARbVq3u0Gl1SL/q3HWkClGMU3oj5XLKzIkIUfOFqs2F+ssS6Rk2HWDIToiMnWmykfbExiFT3OKI3JLGyi8VpjAYakdvKaZrbwcq4X7k1ZYLbebMwQVIhZaKywiYaVtbTB4YxiRXFSvmdmIzOXaEzCmkzIhi46uuimjc0bJalg6/WcBli4ssr6VB0HhRK/yORqvXGHk3M9Zvy/KI9CEb3Cex+9vU3eAbzh537o/id/4lPLRdPT+oB1xWKdS+RsGIIvM2cyRiBmQ1ut+sBFjChdNpPV9blsfAqsQvnrs2IFNlE4bAqoN8op0Ap2Z8BHwRqhMWDFYkQRypJtrDIzmZnNzF1kYSMZYRMdXbIMWQgqzExGFWY244xyY3BcaCLHwXIzWFZxnAhYBcNJVPaccBzy5KHtAl0sOBM1F0s/w7K3ATDAmy5cISaLsRnvA8AZwR6CJ60M3iScsez5gdYmumh5cr3gSu+YWSVkuNYLV/vMaUystZzLIFgxeAw3wtaltCITrdi6axuh7t5FHUh97k3x0mZWmRnHgU84o2yiZZ0MQy50A5Y9VyZUyJxrYrFogbvbyMIauixcbBJdNtwYDAur3AiGlIveXcWy6o5DZJMjgUSqwGZ5GQDvzTpSNngX8O1Au7fGtoG4nnHj6gVS9ZS65IjZMCRHYyPPDguuDZYuQczCOsHlLnMzBU7p2JgOg8GpxWLx6jAqGKQEQ8RgKQJe6s4tFXSheErjGC1rYQ0HzrDvDa0pG+aQymOXipQqasAysxZnyiqZWzjwRfnsVeo5HgxdgottprGCl2K1x8HwbD+qJUOngSgJJTNIuG2AZTcefM+H//Xy8OiYg9dcQ4xiZz2nX7+br/7ut3Fjs0fWbSjuNDR00bGKjlS1Z8zC79z0fH0TuZ47VmZDYChfhMFgaNTv/C8YNVgMjtGXN7RiJ/czqLLOAUE4kTWCYa4N+6ZhZgxNFa2T/EI5jak4EsDMWAxwMw20Yjlwjj1nCBkOPWwSNAauD5k3LIoFX+2VNx6U159cC0+sB1YaCFJiwb30GAw/+9jbviEPn9HB937nVxhu7uMPV2i0DDf3i+VkQ2MjIsrRYsX5o2NOTvf46pV7uPfoOgD/98YFLndt4WhVoiQyeWc5ZRKQd/jLYHA4LJaeQiNeHR7Dni0RsTlgq/Q75IguJ47puZ43+GzxUl1jVQIF2I30ZMl49TSp3GIvA6fAcfDsxxaAr/eZfetJqmxy5DDMGBJ0Wfny9UxW5VQHEpkoiV56MhmHO3Mftw2wv3CCv3gMKqz/4LVsjvfx7cCf/ytf4vipu7nx7HmGwbNaLQjRcX6+ZuYHnjo+z+Wu5emN5eaglIWkBWAyStnNBAsSK9wZp44sudp2oREETlTpQ+LINXgRDpzd7uRYfLKspWMjJaNg1BBNJBHJkgn0BHqi9PV7DRaPp2Vfjwga8OrZmI7T7AkS8OL5yjpgEK7aa3ganDj2dUGWjFOL4hkkTKvyJQOs0YLJaHAs7n0a4yPtXTfor57jwrc/weHpFZ78nT/NE5fvoXWBLnqurve51s3YREMc3UhAySSJJAKZAqLFToAgECXi1AGGTCbWCKHB0BFIMTMXNwVhcj13qtMWGIgSCdJPkwgwsCFrImoB2IghYonSkyRgpYCdyRzXSfDSkggkKr8KqGaCNHX/MBiVYi4S+YXHfuz2Zdo4fvMvPXL/X/7v9y1NGxiunCMHR1rPmN/7DBoNNhqaZuBwvqYLDcd9izeZTbKTS5q0+uGSzl7wyLHqMBjQWB6BRKyPEMUwSMCpIyD02GLZlNzXePP7OsfjuCZXGFgTtSfprZtP1oBigUjSwMAaJ20F3mLxWBxKwuKnpe/U0eqMuTZ1NY5Ohr1tcG8BeBzpZE4OjrBpiV3DwaJDVeifPWK+v+Zitvz277+RIRdlkbVscGnyelKxLHoSscr4gMFU4tgBYEfyGN2+30s3bYwIE52Mn17JmiADHacEXRNzscTncuM4iSPYIpaoPVZ8hcsxYx+jhiA9nna6rkhkw4BXRyJP7u9LGbcAHK4fFMvtPWIz1kVy7+mfPWL/z36N5onzHP/2Efu+3NA6OrpssKbEJZ6P+kfQIhGkcLGptDACYNTgacoxgK2XNgLWy5jBLROnJAY2JA1kzWeAVd3yPuInj0zqhmjFM5dDPC2CJZOxOLy2ZMlYddMOEoj4ei3v/+JbXnJE8BaA43pGChZNFrfoyMEVcL/za3T/5276m3uIKN9y9xW+/MS9bKJjYTMnwSA1v2UQHG5rDRVIrWRgqqIwGFJdmtQJMBgO837hWclspJtWQZLIwJpE4fakYaIFKx7VRNJ4ho9HirDiymYnftr0Gp2TJLLiBknmeFqsOhptiBKnSfuZL/7gyw613mrBm5YUHDF4bN/QLDbMv/UKAMZH3Gxg/+iEJ//w9VhT0jNJoTVKawRvigMxAisUB2O8aSWRGHNoFlcvwdPg1WMQEpleygbWSzfxI8BCD4kV6KGu2O1m5kkaMeJRHQPxVaGYFoOnkQWp0lUnKzYcAzDAZBAADzz29lckfn0LwOvjffquZTbv2Du/Yu+NT2GOInJxn/ZiwP3uKX5/w/VrFzhqO7IKXbKcRos1xeVtxODV0zInSrGoXClBqwaAMZtraNRxmPfYyMBGOrJkBtlMdLGrO5MEBFsnzpMIqJZztmYfNZmkoVhspQQnLVY8jnaSa88dn3r0X96RhMAtAG/Wc1Ky5GxYHJ6S1zPSscFcDmCUdLrPcLLAmsRBuyFlw2nwtEbxUiJlM2M5zHNctqxMWdJRIhaqbOurFbV4WuY6J5EJEqZjY6WBUU7lSh8Wj5Lqc4eTlp5TnLQIBi9zvMwxYkkaUBKNLGgoFNCzIZMndfNrj77vjmZabqWI4EnZEJPl2WfuYv/bvk5Y7TE8fRcAmgzN/pqjCzdI2dJHT2MySUu063xTgi2hV5I6ss7IKKoZi2Ul6zEZgMVj1LCWFUEaYOtSj+/DlsPH1722jPmGTlZE0xO1/LVmH4OlYV5WAmtctdg1x9MkZeDjj77njucVbwH4dDPHu4g1mWFouPI/30QYGnwzcPjaq/gf/w7kU/+Nk8sXMZJpXaCxiUOfyAirKKyqx3HOtbTJMmhxSUPOuGxRkzFiCPT0UrlPwWlRFz2ZVuYE+h1aYbLoQhquSqsBK54+n07gtcw5zOfopEclVcVReDoVX/CPBdxbAJ4tP7IECNFN7sHNG0d4H7j4rU8xe/1V3G/+V7765b/I6aqoiT56vMl0yXCtN1zpYJ0yC2u42BpSbjiNJZP1RFqzMR29bKYNcBy52mmUUTdvZZfF19BQWz0/pjiHwdAwZ5B1iXTpurjIhkoFccfZKSvkY4/+1B9bRvwMwEPaZi6sycwYuOueK8zPH2N8ZPX7ryP+r4bj032evnmePjmeXi+40nuu9oaTAF3KNeWifG0duVmjapFIsMO0g283OjMBkSVXh3hLCyO4Rg27achMJsgwWTnAOfN6EoGNHnPMFaQ6NkpCqpJ58LEPvaLg/vx9n1vCtgzgnZ//njPnPwPwJjSkbJi5gKvlSOuTfYau5fA1z3LzmYs8+cw9nA4zrmwWdMlyfXCsoqFPJSY7prxvpp5eSogv1vTgCOj4uOtlRYkTkDB6btuJyJK3DgNmArfIvoARw0qvM5N9nLRE7etGl0kagchnvvBvXza4H/6uzyzP+dFRgR9+eJuLK/dcxOkD9312+Y5HtiDvZqY5HVpizeambDjeLHjm6kUuX7mLp3/vW/i9p97AtfU+V9Z7nEbHqmYSYj6bVc2AF0urnrkWldDqjFZnzHSPRue0Oi+SScuy99pM4GbJZ9zics7yWpCeIAMlZpcIjBEzS67WW2Sanz4rmJcN7rsvfWz5wTc/vGyN0KWxqKSUIQD8+CN/+wzQ8hx3egq4X37XJ5chGw78wF17J6z6GaehpbWRxkZithwPbUkyJkuXLMfBcRwMXSoplpEihpwJWuDJKA5h0Ey3w4UFQJ2cjtFzUrbg7i7tM0Dv6OlYAc6aMGLJWo614jFYEuFlS7F3vPmjy728wGJQlPNmxswa5tZMgP79h188q2wAvvSjDy+vdbNivWp45vSIr68OOBkanu3mPHV6yPVuRsjlxId+YGYTvubshnS24sWK0BjLzFjmYvEy0oIQJU1RsTF4YrE0Om5kZxbVFO6MjMGjQBzjvZQIWtSuTIymAqzYGhx1k0R7OeOBx95+/8Z0rKWr6at8pjrzG4ELYH7rbQ8tvdEpe3ujb0t8N1lCrZYZsuE4NFzvW46HhnX0xGy4UTO0/Q5FFHALSENO9JrZaJoqYlr1NHpWHb6UPFcikkln4hDAmYkZn99u1uHFxs8+9rb7x4ifF4OqMuTM8HwlTM8z5IFvf7s6UZzJzGziNHhCNqWYDmpJktTithq/VTiNhuMglRa0FtiVL+1rhWHS7Q3GnaK5rOMCV3op+dpBhq2CkK2SGMf4iYHNFOgBpgDO6DZP7jMZRzttpJ949J+9oLW9+1IpbgT4yBd+5AWP+/B3fWZpKNnt3Y3sRQH++J/5EW1MorGZLlmu9S0pbxOJoTaT5B3y7lIB/ekNrKKeyfyq6vPazVgVM1bTJJReI4nMIJEgYasYnnOGXeA7TqcwZXGNZ5McgxLmHDe+Me6QyXhafunRd94Cyi64WfJtJTJfypD/+B1/T8eyppPQsIq2ZmjHSu1ayV0tGQrA1/oxRV6iaWNZvVIKksfpSLotQRrLj8aS0QwEzfQaJ2vWcauT0fXY6uQRhEBf0kKMXG7JpOlxN6DT6vxMUP8XH33H8wL4k5d+Zdlq87Jivi82zOt+7u/ef3NoOAkNQ6WAUIvnxnR8aXMSNlE4DcJxKMB5A/tOOPDCnjPMrDC35XHhhJkt782s0BphUXfgmTHMrWVhTd0IHa04WvW02uBxePVnvDaLY6F72B3+VkrkbPTURmrYjWUE6ekrrbwQuOVY+0Jv/ZHGJNO+8g8/vTSirKPlJNraW1bsMNbnMRer7XNRDUZK7YA32wLnsbhO2DodsO1PS/lsM0pSpc9Kl4o1BopFj9bcSY+SS5ZXLTfMs2cUhE5W7LHiq6roJ8pw0vLpxz7wqhWLy3MbER9/6+eWzpR+hD6XgjzYluSv07ZpD87W+xrAmS2wI6i70nss9Qx1koYMQ84F5JzotZQplaRp1bRY5trQS6CXgUzmRJ5lo8dnNHI5fyTkNQCP/vovvmrAjuOM6Hz8rdWvVrC13GikiAJ4rfWtILa2lKZ6U6pkDhtl4YpPbihVlb6i6005tjXbWuExSToWRJcLEjy2KmLhUBccMmchnn1m7OdF8fxoaWSBkxmCJWkk5mrVmska+e6/+WNLXuVxBuC//sni9mVK8XJWqTm27SgFdeU1oYDtK1jrKHSpVC2WYmVoreLNTv+ZbM/hDTRG6p+hFcNMHHaK+3pasewbR6+JtQ70EmrEzTJjj4Y5gsFJizNtyV6YssF9/tf/3atuwbcG3BVER4+skKkCOcuO1ZVjY13io7VaU+jDVU7uMljdthWM4GLYUcWlXH9mx7piJavjRjRsCESUy2lNlFSSqWoJYkiEGuyp8kx8raS3GDE88sUHXnVw4XkA7lKpzQXd4dbi5anKGcYLlUt97RloqM0gFfSkkGsaaSxHLf0WghcQWyZySAV8b2AVS5/azFhCSgRNU+mSxxImXvYE+jMe3DbA4/mTMs4A/PkfLBEiI0prlKBCY8rz4k4bMsU1zoybVC6a2RRJN/KrjI8UsL3RSVkIitb6YK0dOjEzBea9KYXUC+OZGcOQGzaUDfDEnNLJaopLjONO59Ze7jgD8CivRocCSsWOE50scBylabq2FMi2/8xQHrd9ZoWHW6Nlc0Qn1zvnwj9KkX+blJlZw8UWzmmpzzW1MFuykJPSaMMgm6m88E8qsOM4A/D3/Np99z/8/Y8sNReQWwPWFkB6hKEWNr/lwW0U6efv+9yyNEGfPfGokRujHPlS9i+ixCwlK6YgRqeIWqkstwxZOfAlQz2kslqOU+JpPWZjNkApUHlu1O3VGoc//aHl3nzDxddewbUDq+tHXLt6gSF4Vv3sVh38QuPxt35uOaqM5xu/8r2PLEcr9wb2HCyssu8TF5qAFcWbzM3guT54QpYpjjzkrQNytY/s1XLVa6GUiRoRnpFnWcmNIsmqx3anahleaPzW2x6ami9fNx+49/Am9xze4ODglINzxxibSMFxenzAarXgZL24/V7lFwMXqBtjGVaK5e77xDkfuTjrSoQOxUdX4hLVKxwy3By2fWgbTYRQwj0DkROzopduqvkd47yfePRfvCLgfuS7P7tsjXCuEeYWFk5pDLSmNNC4nT6VcT858ImFqxWhNbzQr2clAmkT1pTmIWtus1f5dsZbHrzv/l/9vrJJtqZc6J5LnGv7QgsqbKIvwSTdens/8Ok722L7QuPfvPnh5Z6z+BqY8lI7mQzsucTMlta0rvbjzWzCm0yfLHs+MLOJPjqur/bpgy/dWSZzvFlw0s3pUjGkV7TbfgR57pQ9mzhwkT0XGLIlRjiplZh/7RO3F0u9E+ODb354OXY0japmt+V2yNBmYcCwqN2svvboeZPIKqyC53hoGAvCR/oL2XAaSxnZUNuKb5uDX8r4jR/+7PINi44Lbc+52Zo+emYf+gev6m7/vkufXnoMTgRnSrzNSMkhApxvHAu3DV6VVrHai822pW3IZmobzgp9fS5SlVAs8ZobIRZv90796tSTP/Gp5Z4LXFis2ISGr50c8qZf+P6XBPJ7Ln1y+aEvvPVlT8z7Lz24XNXMx1w8rRhEZPrNnbHhuzGGPWfYc9uYydxtuXcTS3va1LtHaa48ico6bWPNIWd6TZzWWman9pWliN2RssGbzOF8TUy2uN0vcbxUcJd/6z8tZ+IwIlO6ymNrf0d1qlXpNTE3Dlt/uWRhDd4UeogZ1BaPNlOs8iQo3Tgp9buOU+BUOnrZVtYHMzCwJlAq5Wfs3xmA//Adv7psbGbR9DSV/Bub+B9ve2j5F37579wRqvjApYeWM3G0xtS0VOkKtWrIqnhjOHC2ZmDy1GNn6s/CkMpjyFpb0Yoj1eXERsOUO4QS8RtMmNRNKT6IBO2I2pM10ItnI8evPMDX//HHl+fbRGMjrzm6wYW7r9E0A84krvWv47/80CPLv/Gp21MOH7j00FJR/vkXXrzx+gOXHlpC+WEiX+XJzLjpuZXSDJ61LPc962pSVupPLAgpFz7ucmLQXMppSfQyMJhhqiTaLecaq4rGJGzQzRQuTRrJEu6MBS+anqPFinMXbjA7WNHur7E2szfr+I0n/hSf/YFHll9blXbbVixBMxsd0z6l2cRiphaun7704PK9zwPy+y89uLS15mJmbamw33Epo5afglGFdSz5w1hzgSIlfzi23Q5ZWVdrDRJLIfhO/dtzx5gXHOMheWxpqM04Y03cKwrwlXd9YpnUcjq0GFEuDo7+dIFrAudee4XFwSl/VYWLl1/HvtvnD05bTlPGZIhq609plR/I6Im1Z6689r5Ln14mzcQ6AQbBS8mkebOtcuvrEu/z9vcdoCRck27z1ePxgpAonVGBVJOvA710U0gUSvRubHcY+0Qspe8j0pf2BAMRQ8jFpVfN/D9fervGYxcTfwAAAABJRU5ErkJggg==",[[45,-9.66666666666665],[35,4.99999999999999]],0.8,null,"prec.jan","prec.jan"]},{"method":"addControl","args":["","topright","imageValues","info legend"]},{"method":"addLegend","args":[{"colors":["#000004 , #3E0966 19.1358024691358%, #912568 39.4411955815465%, #DC503B 59.7465886939571%, #FCA50A 80.0519818063678%, #FCFFA4 "],"labels":["50","100","150","200"],"na_color":"#BEBEBE","na_label":"NA","opacity":1,"position":"topright","type":"numeric","title":"prec.jan","extra":{"p_1":0.191358024691358,"p_n":0.800519818063678},"layerId":null,"className":"info legend","group":"prec.jan"}]},{"method":"addLayersControl","args":[["CartoDB.Positron","CartoDB.DarkMatter","OpenStreetMap","Esri.WorldImagery","OpenTopoMap"],"prec.jan",{"collapsed":true,"autoZIndex":true,"position":"topleft"}]},{"method":"addScaleBar","args":[{"maxWidth":100,"metric":true,"imperial":true,"updateWhenIdle":true,"position":"bottomleft"}]},{"method":"addHomeButton","args":[-9.99999999999999,35,4.99999999999999,45,"Zoom to prec.jan","<strong> prec.jan <\/strong>","bottomright"]}],"limits":{"lat":[35,45],"lng":[-9.66666666666665,4.99999999999999]}},"evals":[],"jsHooks":{"render":[{"code":"function(el, x, data) {\n return (function(el, x, data) {\n var map = this;\n map.on(\"mousemove\", function (e) {\n rasterPicker.pick(e, x, null, \"Layer \");\n });\n }).call(this.getMap(), el, x, data);\n}","data":null},{"code":"function(el, x, data) {\n return (\n function(el, x, data) {\n // get the leaflet map\n var map = this; //HTMLWidgets.find('#' + el.id);\n // we need a new div element because we have to handle\n // the mouseover output separately\n // debugger;\n function addElement () {\n // generate new div Element\n var newDiv = $(document.createElement('div'));\n // append at end of leaflet htmlwidget container\n $(el).append(newDiv);\n //provide ID and style\n newDiv.addClass('lnlt');\n newDiv.css({\n 'position': 'relative',\n 'bottomleft': '0px',\n 'background-color': 'rgba(255, 255, 255, 0.7)',\n 'box-shadow': '0 0 2px #bbb',\n 'background-clip': 'padding-box',\n 'margin': '0',\n 'padding-left': '5px',\n 'color': '#333',\n 'font': '9px/1.5 \"Helvetica Neue\", Arial, Helvetica, sans-serif',\n 'z-index': '700',\n });\n return newDiv;\n }\n\n\n // check for already existing lnlt class to not duplicate\n var lnlt = $(el).find('.lnlt');\n\n if(!lnlt.length) {\n lnlt = addElement();\n\n // grab the special div we generated in the beginning\n // and put the mousmove output there\n\n map.on('mousemove', function (e) {\n if (e.originalEvent.ctrlKey) {\n if (document.querySelector('.lnlt') === null) lnlt = addElement();\n lnlt.text(\n ' lon: ' + (e.latlng.lng).toFixed(5) +\n ' | lat: ' + (e.latlng.lat).toFixed(5) +\n ' | zoom: ' + map.getZoom() +\n ' | x: ' + L.CRS.EPSG3857.project(e.latlng).x.toFixed(0) +\n ' | y: ' + L.CRS.EPSG3857.project(e.latlng).y.toFixed(0) +\n ' | epsg: 3857 ' +\n ' | proj4: +proj=merc +a=6378137 +b=6378137 +lat_ts=0.0 +lon_0=0.0 +x_0=0.0 +y_0=0 +k=1.0 +units=m +nadgrids=@null +no_defs ');\n } else {\n if (document.querySelector('.lnlt') === null) lnlt = addElement();\n lnlt.text(\n ' lon: ' + (e.latlng.lng).toFixed(5) +\n ' | lat: ' + (e.latlng.lat).toFixed(5) +\n ' | zoom: ' + map.getZoom() + ' ');\n }\n });\n\n // remove the lnlt div when mouse leaves map\n map.on('mouseout', function (e) {\n var strip = document.querySelector('.lnlt');\n strip.remove();\n });\n\n };\n\n //$(el).keypress(67, function(e) {\n map.on('preclick', function(e) {\n if (e.originalEvent.ctrlKey) {\n if (document.querySelector('.lnlt') === null) lnlt = addElement();\n lnlt.text(\n ' lon: ' + (e.latlng.lng).toFixed(5) +\n ' | lat: ' + (e.latlng.lat).toFixed(5) +\n ' | zoom: ' + map.getZoom() + ' ');\n var txt = document.querySelector('.lnlt').textContent;\n console.log(txt);\n //txt.innerText.focus();\n //txt.select();\n setClipboardText('\"' + txt + '\"');\n }\n });\n\n //map.on('click', function (e) {\n // var txt = document.querySelector('.lnlt').textContent;\n // console.log(txt);\n // //txt.innerText.focus();\n // //txt.select();\n // setClipboardText(txt);\n //});\n\n function setClipboardText(text){\n var id = 'mycustom-clipboard-textarea-hidden-id';\n var existsTextarea = document.getElementById(id);\n\n if(!existsTextarea){\n console.log('Creating textarea');\n var textarea = document.createElement('textarea');\n textarea.id = id;\n // Place in top-left corner of screen regardless of scroll position.\n textarea.style.position = 'fixed';\n textarea.style.top = 0;\n textarea.style.left = 0;\n\n // Ensure it has a small width and height. Setting to 1px / 1em\n // doesn't work as this gives a negative w/h on some browsers.\n textarea.style.width = '1px';\n textarea.style.height = '1px';\n\n // We don't need padding, reducing the size if it does flash render.\n textarea.style.padding = 0;\n\n // Clean up any borders.\n textarea.style.border = 'none';\n textarea.style.outline = 'none';\n textarea.style.boxShadow = 'none';\n\n // Avoid flash of white box if rendered for any reason.\n textarea.style.background = 'transparent';\n document.querySelector('body').appendChild(textarea);\n console.log('The textarea now exists :)');\n existsTextarea = document.getElementById(id);\n }else{\n console.log('The textarea already exists :3')\n }\n\n existsTextarea.value = text;\n existsTextarea.select();\n\n try {\n var status = document.execCommand('copy');\n if(!status){\n console.error('Cannot copy text');\n }else{\n console.log('The text is now on the clipboard');\n }\n } catch (err) {\n console.log('Unable to copy.');\n }\n }\n\n\n }\n ).call(this.getMap(), el, x, data);\n}","data":null}]}}</script> --- ## Monthly Precipitation in Spain (rasterVis) <!-- --> --- ## Elevation map of Spain <!-- --> --- ## END  Slides and source code available at https://github.com/Pakillo/GISwithR